OpenShift provides ways to observe and monitor cluster health. When we have more clusters, we want to monitor all clusters from a centralized location. We can use Red Hat Advanced Cluster Management (RHACM) helps to manage and control all the clusters from a single console. Also, we can enable observability from ACM to observe all clusters from RHACM.
The biggest complaint I got is that we are getting so many alerts. How do we really know when and how to react to the alerts that my organization cares about?
This is my example of how I will start tackling the issue. I am going to share the steps here on how I set up my OpenShift environment to try to solve the problem.
Environment:
- OpenShift 4.11
- Red Hat Advanced Cluster Management Operator 2.7
My test environment
- Install OpenShift 4.11
- Install Red Hat Advanced Cluster Management Operator 2.7
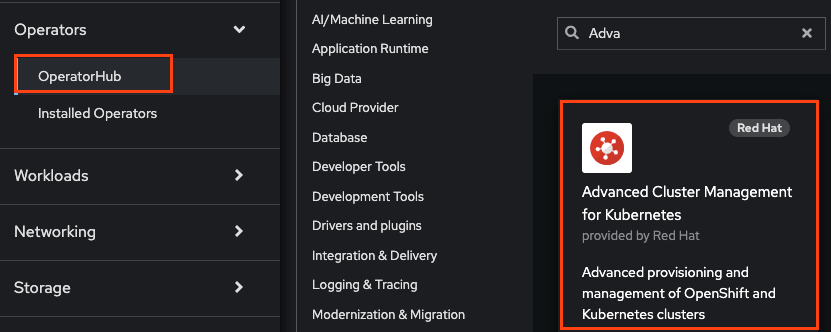
Click the OperatorHub from the OpenShift console left menu -> click on “Advanced Cluster Management for Kubernetes” Tile -> click install
- Once RHACM is installed and create “MultiClusterHub” customer resource (CR)
Enable the Observability
- Prepare an S3 bucket. In my case, I used AWS for my object storage.
aws s3 mb s3://shchan-acm
- Create “open-cluster-management-observability” namespace
oc create namespace open-cluster-management-observability
- Create “pull-secret” in the namespace
DOCKER_CONFIG_JSON=`oc extract secret/pull-secret -n openshift-config --to=-`

oc create secret generic multiclusterhub-operator-pull-secret \
    -n open-cluster-management-observability \
    --from-literal=.dockerconfigjson="$DOCKER_CONFIG_JSON" \
    --type=kubernetes.io/dockerconfigjson
- Create a YAML file as below and name it “thanos-object-storage.yaml.” The credential will need to have proper permission to access the bucket. I am using an IAM user that has full access to the bucket. See the reference section for permission details.
apiVersion: v1
kind: Secret
metadata:
  name: thanos-object-storage
  namespace: open-cluster-management-observability
type: Opaque
stringData:
  thanos.yaml: |
    type: s3
    config:
      bucket: shchan-acm
      endpoint: s3.us-east-2.amazonaws.com
      insecure: true
      access_key: xxxxxxxxxxxxxxxxx
      secret_key: xxxxxxxxxxxxxxxxxxxxxxxxxxxxxxxxxx
- Create the secret for object storage
oc create -f thanos-object-storage.yaml -n open-cluster-management-observability
- Create MultiClusterObservability customer resource in a YAML file, multiclusterobservability_cr.yaml.
apiVersion: observability.open-cluster-management.io/v1beta2
kind: MultiClusterObservability
metadata:
  name: observability
spec:
  observabilityAddonSpec: {}
  storageConfig:
    metricObjectStorage:
      name: thanos-object-storage
      key: thanos.yaml
- Run the following command to create the CR
oc apply -f multiclusterobservability_cr.yaml
Create custom rule
The use case here is to get a notification for a given issue when it happens. Since every alert is sent to the same notifier. It is not easy to react to the important alert.
- Create a “kube-node-health” group for alerting when any node is down for any reason. Create a Configmap “thanos-ruler-custom-rules” with the following rules in the open-cluster-management-observability namespace. Add “custom_rules.yaml” in the data section of the YAML file. Noted that I added “tag: kubenode” in the labels section. Note that it can be any label. This is just an example.
data:
 custom_rules.yaml: |
   groups:
     - name: kube-node-health
       rules:
       - alert: NodeNotReady
         annotations:
           summary: Notify when any node on a cluster is in NotReady state
           description: "One of the node of the cluster is down: Cluster {{ $labels.cluster }} {{ $labels.clusterID }}."
         expr: kube_node_status_condition{condition="Ready",job="kube-state-metrics",status="true"} != 1
         for: 5s
         labels:
           instance: "{{ $labels.instance }}"
           cluster: "{{ $labels.cluster }}"
           clusterID: "{{ $labels.clusterID }}"
           tag: kubenode
           severity: critical
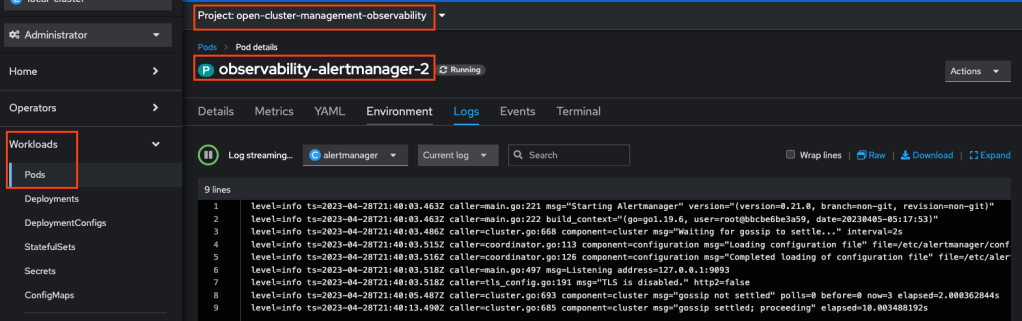
- You can view the logs from one of the alert manager pods to monitor if the rules are applied correctly. You can check if the log has any errors.
To test the alert from the ACM console
- Shut down one worker node
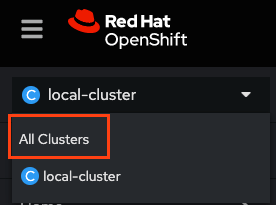
- Go to ACM
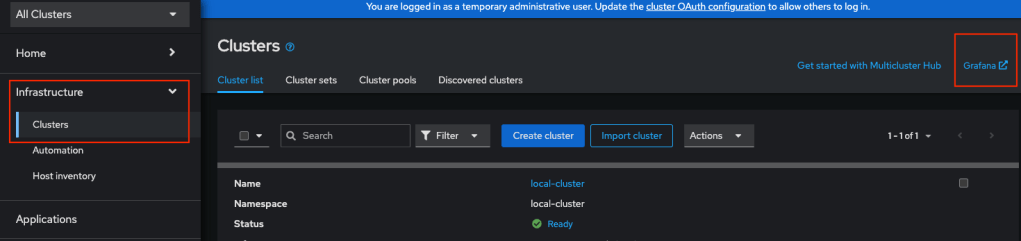
- Click Infrastucture -> Cluster -> Grafana
- Login the grafana dashboard
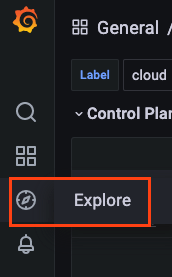
- Click “Explore”
- Click “Metrics browser to expand
- Select “alertname” and all the and “NodeNotReady” alert shows up under the list
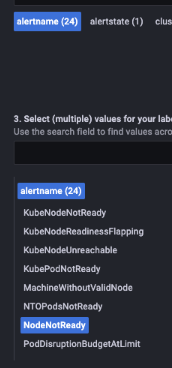
- Here the alert was fired because one of the nodes was down.
Let’s configure the alert manager
We want to send this “NodeNotReady” alert to a specific Slack channel.
- Extract the data from the “alertmanager-config secret.
oc -n open-cluster-management-observability get secret alertmanager-config --template='{{ index .data "alertmanager.yaml" }}' |base64 -d > alertmanager.yaml
- Edit the alert-manager.yaml file as the following example. Note that I have 2 Slack channels for 2 receivers, respectively. One for the specific “tag: kubenode” alert and the other one for all the rest alerts.
"global":
  "slack_api_url": "https://hooks.slack.com/services/TDxxxx3S6/B0xxxxZLE2D/BN35PToxxxxmRTRxxxxN6R4"

"route":
  "group_by":
  - "alertname"
  "group_interval": "5m"
  "group_wait": "30s"
  "repeat_interval": "12h"
  "receiver": "my-team"
  "routes":
  - "match":
      "tag": "kubenode"
    "receiver": "slack-notification"

"receivers":
- "name": "slack-notification"
  "slack_configs":
  - "api_url": "https://hooks.slack.com/services/TDxxxx3S6/B0xxxxUK7B7/vMtVpxxxx4kESxxxxeDSYu3"
    "channel": "#kubenode"
    "text": "{{ range .Alerts }}<!channel> {{ .Annotations.summary }}\n{{ .Annotations.description }}\n{{ end }}"


- "name": "my-team"
  "slack_configs":
  - "api_url": "https://hooks.slack.com/services/TDxxxx3S6/B0xxxxZLE2D/BN35PToxxxxmRTRxxxxN6R4"
    "channel": "#critical-alert"
    "text": "{{ .GroupLabels.alertname }}"
- Save the alertmanager.yaml and replace the secret.
oc -n open-cluster-management-observability create secret generic alertmanager-config --from-file=alertmanager.yaml --dry-run=client -o=yaml | oc -n open-cluster-management-observability replace secret --filename=-
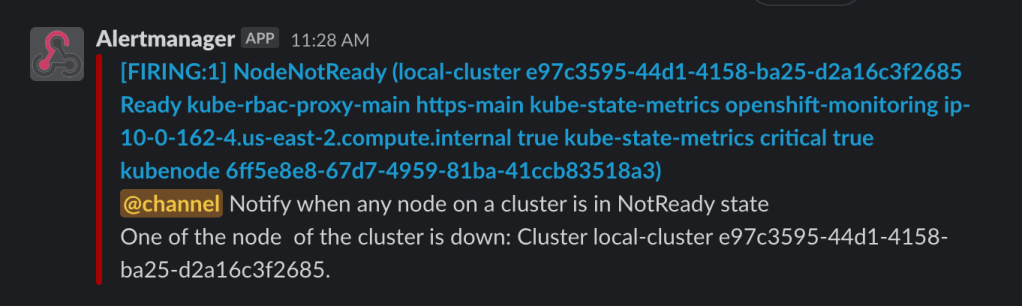
- When the Node is shut down, a message should show in the slack channel like the one below.
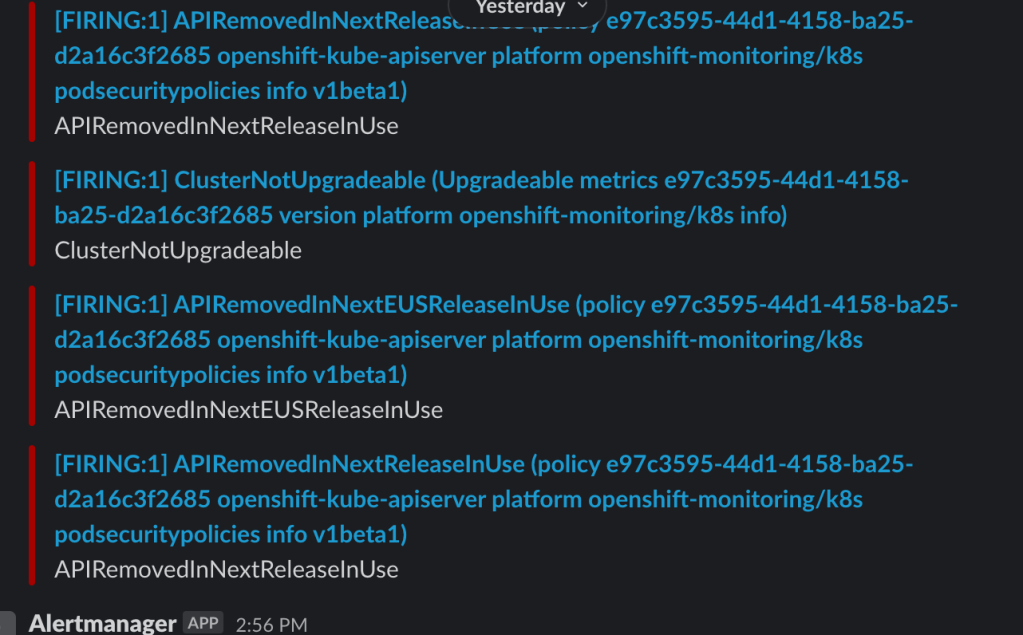
- You will also see many alerts show up on the other channel, like the one below.
The idea here is to get meaningful alerts to the team and know what to do with the alerts.
The next is to continue to refine the customer rules and alert manager configuration per the needs.

One thought on “Way too many alerts? Which alerts are important?”