My task is to figure out how to configure the Metering correlating AWS billing. The OpenShift documentation in the reference is where I started. I decided to record the end-to-end steps on how I set this up since there were some lessons learned in the process of it. I hope this helps you to set up the Metering with AWS billing much smoother.
Prerequisites:
Setting up AWS Report
- Before creating anything, you need to have data in the
Billing & Cost Management Dashboardalready. - If you have a brand new account, you may have to wait until you get some data to show up before you proceed. You will have to have access to
Cost & Usage Report underAWS Billingto set up the report. - Log in to AWS, go to
My Billing Dashboard - Click
Cost & Usage Reports - Click
Create reports - Provide a name and check
Include resource IDs - Click
Next - Click Configure → add
S3 bucket nameandRegion-> clickNext - Provide `prefix` and select your options for your report → Click
Next - Once you created a report similar to the following
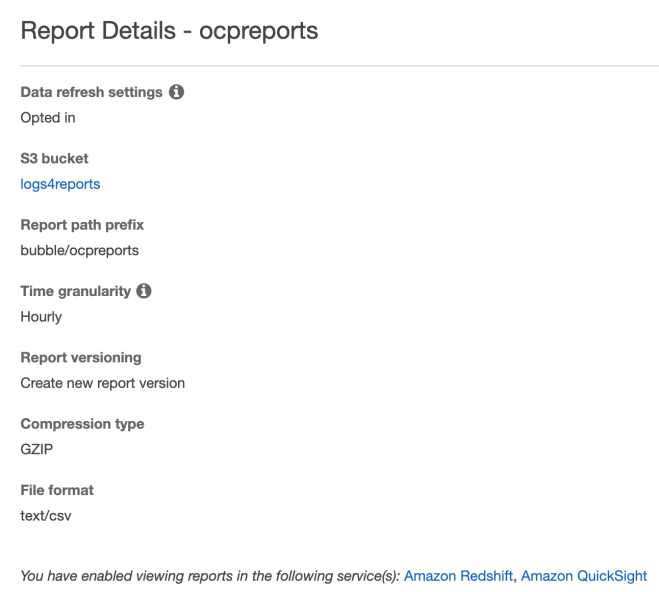
- Click onto the S3 bucket and validate reports are being created under the folder.
- Click
Permissionstab - Click
Bucket Policy - Copy and save the bucket policy somewhere you can get back to
Setting up AWS user permission policy
- Go to
My Security Credentials - Click
Users→ Click the username name will be used for accessing the reports and for OpenShift metering. - Click
Add Permissions→Attach existing policies directly →Create policy→ clickJSON - Paste the buck policy from the
Cost & Usagereport from the s3 bucket step #14 in the last session. - Use the same step to add the following policy:
{ "Version": "2012-10-17", "Statement": [ { "Sid": "1", "Effect": "Allow", "Action": [ "s3:AbortMultipartUpload", "s3:DeleteObject", "s3:GetObject", "s3:HeadBucket", "s3:ListBucket", "s3:ListMultipartUploadParts", "s3:PutObject" ], "Resource": [ "arn:aws:s3:::<YOUR S3 BUCKET NAME FOR BILLING REPORT>/*", "arn:aws:s3:::<YOUR S3 BUCKET NAME FOR BILLING REPORT>" ] } ] } - Since I am using s3 bucket for metering storage, I also added the following policy to the user:
{
    "Version": "2012-10-17",
    "Statement": [
        {
            "Sid": "1",
            "Effect": "Allow",
            "Action": [
                "s3:AbortMultipartUpload",
                "s3:DeleteObject",
                "s3:GetObject",
                "s3:HeadBucket",
                "s3:ListBucket",
                "s3:CreateBucket",
                "s3:DeleteBucket",
                "s3:ListMultipartUploadParts",
                "s3:PutObject"
            ],
            "Resource": [
                "arn:aws:s3:::<YOUR S3 BUCKET NAME FOR METERING STORAGE>/*",
                "arn:aws:s3:::<YOUR S3 BUCKET NAME FOR METERING STORAGE>"
            ]
        }
    ]
}
Configuration:
Install Metering Operator
- Login OpenShift Container Platform web console as cluster-admin, click
Administration→Namespaces→Create Namespace - Enter
openshift-metering - Add
openshift.io/cluster-monitoring=trueas label → clickCreate. - Click
Compute→Machine Sets - If you are like me, the cluster is using the default configuration on AWS. In my test, I increase 1 more worker per AZs.
- I notice that one pod for Metering requires more resources, and the standard size may not be big enough. I create an m5.2xlarge machine set. I only need 1 replica for this machineset.
- Create a template machine-set YAML:
oc project openshift-machine-api
oc get machineset poc-p6czj-worker-us-west-2a -o yaml > m52xLms.yaml
- Modify the YAML file by updating the name of the machine set and instance type, removing the status, timestamp, id, selflink, etc… Here is my example of a machine set for m5.2xlarge.
apiVersion: machine.openshift.io/v1beta1 kind: MachineSet metadata: labels: machine.openshift.io/cluster-api-cluster: poc-p6czj name: poc-p6czj-xl-worker-us-west-2a namespace: openshift-machine-api spec: replicas: 1 selector: matchLabels: machine.openshift.io/cluster-api-cluster: poc-p6czj machine.openshift.io/cluster-api-machineset: poc-p6czj-xl-worker-us-west-2a template: metadata: creationTimestamp: null labels: machine.openshift.io/cluster-api-cluster: poc-p6czj machine.openshift.io/cluster-api-machine-role: worker machine.openshift.io/cluster-api-machine-type: worker machine.openshift.io/cluster-api-machineset: poc-p6czj-xl-worker-us-west-2a spec: metadata: creationTimestamp: null providerSpec: value: ami: id: ami-0f0fac946d1d31e97 apiVersion: awsproviderconfig.openshift.io/v1beta1 blockDevices: - ebs: iops: 0 volumeSize: 120 volumeType: gp2 credentialsSecret: name: aws-cloud-credentials deviceIndex: 0 iamInstanceProfile: id: poc-p6czj-worker-profile instanceType: m5.2xlarge kind: AWSMachineProviderConfig metadata: creationTimestamp: null placement: availabilityZone: us-west-2a region: us-west-2 publicIp: null securityGroups: - filters: - name: tag:Name values: - poc-p6czj-worker-sg subnet: filters: - name: tag:Name values: - poc-p6czj-private-us-west-2a tags: - name: kubernetes.io/cluster/poc-p6czj value: owned userDataSecret: name: worker-user-data - run:
oc create -f m52xLms.yaml
# wait for the new machine for m5.2xlarge created
oc get machineset
- Create a template machine-set YAML:
- Create a secret to access the AWS account and make sure you are cluster-admin and run the following commands:
oc project openshift-metering
oc create secret -n openshift-metering generic my-aws-secret --from-literal=aws-access-key-id=<YOUR AWS KEY> --from-literal=aws-secret-access-key=<YOUR AWS SECRET>
- Back to Console, click
Operators→OperatorHuband type ‘metering` in the filter to find the Metering Operator. - Click the Metering (provided by Red Hat), review the package description, and then click
install. - Under Installation Mode, select
openshift-meteringas namespace. Specify your update channel and approval strategy, then clickSubscribeto install Metering. - Click
Installed Operatorsfrom the left menu, wait forSucceededas status is shown next to theMeteringOperator. - Click
Workloads→Pods→ metering operator pod is inRunningstate - Go back to your terminal, run:
oc project openshift-metering
- We are now ready to create the MeteringConfig Object. Create a file `metering-config.yaml` as shown below. See the reference for more details of the MeteringConfig object.
apiVersion: metering.openshift.io/v1 kind: MeteringConfig metadata: name: operator-metering namespace: openshift-metering spec: openshift-reporting: spec: awsBillingReportDataSource: enabled: true bucket: "logs4reports" prefix: "bubble/ocpreports/" region: "us-west-2" storage: type: hive hive: s3: bucket: shanna-meter/demo createBucket: true region: us-west-2 secretName: my-aws-secret type: s3 presto: spec: config: aws: secretName: my-aws-secret hive: spec: config: aws: secretName: my-aws-secret reporting-operator: spec: config: aws: secretName: my-aws-secret resources: limits: cpu: 1 memory: 500Mi requests: cpu: 500m memory: 100Mi - Create MeteringConfig:
oc create -f metering-config.yaml
- To monitor the process:
watch 'oc get pod'
- Wait until you see all pods are up and running:
$ oc get pods
NAME                              READY STATUS   RESTARTS AGE
hive-metastore-0                   2/2   Running 0        2m35s
hive-server-0                      3/3   Running 0        2m36s
metering-operator-69b664dc57-knd86 2/2   Running 0        31m
presto-coordinator-0               2/2   Running 0        2m8s
reporting-operator-674cb5d7b-zxwf4 1/2   Running 0        96s
- Verify the AWS report data source:
$ oc get reportdatasource |grep aws
aws-billing                                                                                                                                                     3m41s
aws-ec2-billing-data-raw
- Verify the AWS report queries:
$ oc get reportquery |grep aws
aws-ec2-billing-data                         5m19s
aws-ec2-billing-data-raw                     5m19s
aws-ec2-cluster-cost                         5m19s
pod-cpu-request-aws                          5m19s
pod-cpu-usage-aws                            5m19s
pod-memory-request-aws                       5m18s
pod-memory-usage-aws                         5m18s
For more information about the
ReportDataSourceand theReportQuery, please check out the GitHub link in the reference. - Create reports to get AWS billing from the following YAML:
apiVersion: metering.openshift.io/v1
kind: Report
metadata:
  name: pod-cpu-request-billing-run-once
spec:
  query: "pod-cpu-request-aws"
  reportingStart: '2020-04-12T00:00:00Z'
  reportingEnd: '2020-04-30T00:00:00Z'
  runImmediately: true
---
apiVersion: metering.openshift.io/v1
kind: Report
metadata:
  name: pod-memory-request-billing-run-once
spec:
  query: "pod-memory-request-aws"
  reportingStart: '2020-04-12T00:00:00Z'
  reportingEnd: '2020-04-30T00:00:00Z'
  runImmediately: true
- Create reports (status as `RunImmediately`):
$ oc create -f aws-reports.yaml
$ oc get reports
NAME                                  QUERY                    SCHEDULE   RUNNING          FAILED   LAST REPORT TIME   AGE
pod-cpu-request-billing-run-once      pod-cpu-request-aws                 RunImmediately                               5s
pod-memory-request-billing-run-once   pod-memory-request-aws              RunImmediately                               5s
- Wait until reports are completed (status as `Finished`):
$ oc get reports
NAME                                  QUERY                    SCHEDULE   RUNNING    FAILED   LAST REPORT TIME       AGE
pod-cpu-request-billing-run-once      pod-cpu-request-aws                 Finished            2020-04-30T00:00:00Z   79s
pod-memory-request-billing-run-once   pod-memory-request-aws              Finished            2020-04-30T00:00:00Z   79s
- I created a simple script (viewReport.sh) as shown below to view any report which requires $1 as the name of the report from
oc get reportsreportName=$1 reportFormat=csv token="$(oc whoami -t)" meteringRoute="$(oc get routes metering -o jsonpath='{.spec.host}')" curl --insecure -H "Authorization: Bearer ${token}" "https://${meteringRoute}/api/v1/reports/get?name=${reportName}&namespace=openshift-metering&format=$reportFormat" - Before running the script, please make sure you get a validate token via
oc whoami -t - View report by run the simple script in step #23:
./viewReport.sh pod-cpu-request-billing-run-once
period_start,period_end,pod,namespace,node,pod_request_cpu_core_seconds,pod_cpu_usage_percent,pod_cost
2020-04-12 00:00:00 +0000 UTC,2020-04-30 00:00:00 +0000 UTC,alertmanager-main-0,openshift-monitoring,ip-10-0-174-47.us-west-2.compute.internal,792.000000,0.006587,
2020-04-12 00:00:00 +0000 UTC,2020-04-30 00:00:00 +0000 UTC,alertmanager-main-1,openshift-monitoring,ip-10-0-138-24.us-west-2.compute.internal,792.000000,0.006587,
2020-04-12 00:00:00 +0000 UTC,2020-04-30 00:00:00 +0000 UTC,alertmanager-main-2,openshift-monitoring,ip-10-0-148-172.us-west-2.compute.internal,792.000000,0.006587,
2020-04-12 00:00:00 +0000 UTC,2020-04-30 00:00:00 +0000 UTC,apiserver-9dhcr,openshift-apiserver,ip-10-0-157-2.us-west-2.compute.internal,1080.000000,0.008982,
2020-04-12 00:00:00 +0000 UTC,2020-04-30 00:00:00 +0000 UTC,apiserver-fr7w5,openshift-apiserver,ip-10-0-171-27.us-west-2.compute.internal,1080.000000,0.008982,
2020-04-12 00:00:00 +0000 UTC,2020-04-30 00:00:00 +0000 UTC,apiserver-sdlsj,openshift-apiserver,ip-10-0-139-242.us-west-2.compute.internal,1080.000000,0.008982,
2020-04-12 00:00:00 +0000 UTC,2020-04-30 00:00:00 +0000 UTC,apiservice-cabundle-injector-54ff756f6d-f4vl6,openshift-service-ca,ip-10-0-157-2.us-west-2.compute.internal,72.000000,0.000599,
2020-04-12 00:00:00 +0000 UTC,2020-04-30 00:00:00 +0000 UTC,authentication-operator-6d865c4957-2jsql,openshift-authentication-operator,ip-10-0-171-27.us-west-2.compute.internal,72.000000,0.000599,
2020-04-12 00:00:00 +0000 UTC,2020-04-30 00:00:00 +0000 UTC,catalog-operator-868fd6ddb5-rmfk7,openshift-operator-lifecycle-manager,ip-10-0-139-242.us-west-2.compute.internal,72.000000,0.000599,
2020-04-12 00:00:00 +0000 UTC,2020-04-30 00:00:00 +0000 UTC,certified-operators-58874b4f86-rcbsl,openshift-marketplace,ip-10-0-148-172.us-west-2.compute.internal,20.400000,0.000170,
2020-04-12 00:00:00 +0000 UTC,2020-04-30 00:00:00 +0000 UTC,certified-operators-5b86f97d6f-pcvqk,openshift-marketplace,ip-10-0-148-172.us-west-2.compute.internal,16.800000,0.000140,
2020-04-12 00:00:00 +0000 UTC,2020-04-30 00:00:00 +0000 UTC,certified-operators-5fdf46bd6d-hhtqd,openshift-marketplace,ip-10-0-148-172.us-west-2.compute.internal,37.200000,0.000309,
2020-04-12 00:00:00 +0000 UTC,2020-04-30 00:00:00 +0000 UTC,cloud-credential-operator-868c5f9f7f-tw5pn,openshift-cloud-credential-operator,ip-10-0-157-2.us-west-2.compute.internal,72.000000,0.000599,
2020-04-12 00:00:00 +0000 UTC,2020-04-30 00:00:00 +0000 UTC,cluster-autoscaler-operator-74b5d8858b-bwtfc,openshift-machine-api,ip-10-0-139-242.us-west-2.compute.internal,144.000000,0.001198,
2020-04-12 00:00:00 +0000 UTC,2020-04-30 00:00:00 +0000 UTC,cluster-image-registry-operator-9754995-cqm7v,openshift-image-registry,ip-10-0-139-242.us-west-2.compute.internal,144.000000,0.001198,
...
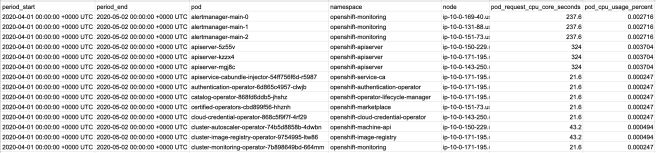
- The output from the preview steps are not too readable. Instead, I downloaded the output from the previous step into a file.
./viewReport.sh pod-cpu-request-billing-run-once > aws-pod-cpu-billing.txt
- Import the output file into a spreadsheet as shown below:
Troubleshoot:
The most useful log is the report operator log for debugging any report issues.
Reference:
OpenShift metering documentation: https://docs.openshift.com/container-platform/4.3/metering/metering-about-metering.html
Configure AWS Billing Correlation: https://docs.openshift.com/container-platform/4.6/metering/configuring_metering/metering-configure-aws-billing-correlation.html
Addition information: https://github.com/kube-reporting/metering-operator/blob/master/Documentation/metering-architecture.md
