One of the most frequently asked questions recently is how to install OpenShift on AWS with temporary credentials. The default OpenShift provisioning using AWS key and secret, which requires the Administrator privileges. The temporary credential often refers to AWS Security Token Service (STS), which allows end-users to assume an IAM role resulting in short-lived credentials.
Developers or platform teams will require approval from their security team to access the company AWS account. It can be challenging in some organizations to get access to Administrator privileges.
OpenShift 4.7 support for AWS Secure Token Service in manual mode is in Tech Preview. I decided to explore a little deeper—the exercise based on the information both on the OpenShift documentation and the upstream repos. I am recording the notes from my test run. I hope you will find it helpful.
OpenShift 4 version
OCP 4.7.9
Build sts-preflight binary
git clone https://github.com/sjenning/sts-preflight.git
go get github.com/sjenning/sts-preflight
cd <sts-preflight directory>
go build .
Getting the AWS STS
As an AWS administrator, I found the sts-preflight tool helpful in this exercise. The documentation has the manual steps, but I choose to use the sts-preflight tool here.
Create STS infrastructure in AWS:
./sts-preflight  create --infra-name <sts infra name> --region <aws region>

# ./sts-preflight  create --infra-name sc-example --region us-west-1
2021/04/28 13:24:42 Generating RSA keypair
2021/04/28 13:24:56 Writing private key to _output/sa-signer
2021/04/28 13:24:56 Writing public key to _output/sa-signer.pub
2021/04/28 13:24:56 Copying signing key for use by installer
2021/04/28 13:24:56 Reading public key
2021/04/28 13:24:56 Writing JWKS to _output/keys.json
2021/04/28 13:24:57 Bucket sc-example-installer created
2021/04/28 13:24:57 OIDC discovery document at .well-known/openid-configuration updated
2021/04/28 13:24:57 JWKS at keys.json updated
2021/04/28 13:24:57 OIDC provider created arn:aws:iam::##########:oidc-provider/s3.us-west-1.amazonaws.com/sc-example-installer
2021/04/28 13:24:57 Role created arn:aws:iam::##########:role/sc-example-installer
2021/04/28 13:24:58 AdministratorAccess attached to Role sc-example-installer
Create an OIDC token:
# ./sts-preflight token
2021/04/28 13:27:06 Token written to _output/token
Get STS credential:
# ./sts-preflight assume
Run these commands to use the STS credentials
export AWS_ACCESS_KEY_ID=<temporary key>
export AWS_SECRET_ACCESS_KEY=<temporary secret>
export AWS_SESSION_TOKEN=<session token>
The above short-lived key, secret, and token can be given to the person who are installing OpenShift.
Export all the AWS environment variables before proceeding to installation.
Start the Installation
As a Developer or OpenShift Admin, you will get the temporary credentials information and export the AWS environment variables before installing the OCP cluster.
Download OpenShift CLI (oc) and OpenShift installer:
# ./openshift-install create install-config --dir=./sc-sts
? SSH Public Key /root/.ssh/id_rsa.pub
? Platform aws
INFO Credentials loaded from default AWS environment variables
? Region us-east-1
? Base Domain sc.ocp4demo.live
? Cluster Name sc-sts
? Pull Secret [? for help]
INFO Install-Config created in: sc-sts
Make sure that we install the cluster in Manual mode:
# cd sc-sts
# echo "credentialsMode: Manual" >> install-config.yaml
Create install manifests:
# cd ..
# ./openshift-install create manifests --dir=./sc-sts
Using the sts-preflight tool to create AWS resources. Make sure you are in the sts-preflight directory:
#./sts-preflight create --infra-name sc-example --region us-west-1 --credentials-requests-to-roles ./credreqs.yaml
2021/04/28 13:45:34 Generating RSA keypair
2021/04/28 13:45:42 Writing private key to _output/sa-signer
2021/04/28 13:45:42 Writing public key to _output/sa-signer.pub
2021/04/28 13:45:42 Copying signing key for use by installer
2021/04/28 13:45:42 Reading public key
2021/04/28 13:45:42 Writing JWKS to _output/keys.json
2021/04/28 13:45:42 Bucket sc-example-installer already exists and is owned by us
2021/04/28 13:45:42 OIDC discovery document at .well-known/openid-configuration updated
2021/04/28 13:45:42 JWKS at keys.json updated
2021/04/28 13:45:43 Existing OIDC provider found arn:aws:iam::000000000000:oidc-provider/s3.us-west-1.amazonaws.com/sc-example-installer
2021/04/28 13:45:43 Existing Role found arn:aws:iam::000000000000:role/sc-example-installer
2021/04/28 13:45:43 AdministratorAccess attached to Role sc-example-installer
2021/04/28 13:45:43 Role arn:aws:iam::000000000000:role/sc-example-openshift-machine-api-aws-cloud-credentials created
2021/04/28 13:45:43 Saved credentials configuration to: _output/manifests/openshift-machine-api-aws-cloud-credentials-credentials.yaml
2021/04/28 13:45:43 Role arn:aws:iam::000000000000:role/sc-example-openshift-cloud-credential-operator-cloud-credential- created
2021/04/28 13:45:44 Saved credentials configuration to: _output/manifests/openshift-cloud-credential-operator-cloud-credential-operator-iam-ro-creds-credentials.yaml
2021/04/28 13:45:44 Role arn:aws:iam::000000000000:role/sc-example-openshift-image-registry-installer-cloud-credentials created
2021/04/28 13:45:44 Saved credentials configuration to: _output/manifests/openshift-image-registry-installer-cloud-credentials-credentials.yaml
2021/04/28 13:45:44 Role arn:aws:iam::000000000000:role/sc-example-openshift-ingress-operator-cloud-credentials created
2021/04/28 13:45:44 Saved credentials configuration to: _output/manifests/openshift-ingress-operator-cloud-credentials-credentials.yaml
2021/04/28 13:45:45 Role arn:aws:iam::000000000000:role/sc-example-openshift-cluster-csi-drivers-ebs-cloud-credentials created
2021/04/28 13:45:45 Saved credentials configuration to: _output/manifests/openshift-cluster-csi-drivers-ebs-cloud-credentials-credentials.yaml
Copy the generated manifest files and tls directory from sts-preflight/_output directory to installation directory:
# cp sts-preflight/_output/manifests/* sc-scs/manifests/
# cp -a sts-preflight/_output/tls sc-scs/
I ran both ./sts-preflight token and ./sts-preflight assume again to make sure I have enough time to finish my installation
Export the AWS environment variables.
I did not further restrict the role in my test.
Start to provision a OCP cluster:
# ./openshift-install create cluster --log-level=debug --dir=./sc-sts
...
INFO Install complete!
INFO To access the cluster as the system:admin user when using 'oc', run 'export KUBECONFIG=/root/mufg-sts/sc-sts-test/auth/kubeconfig'
INFO Access the OpenShift web-console here: https://console-openshift-console.apps.sc-sts-test.xx.live
INFO Login to the console with user: "kubeadmin", and password: "xxxxxxxxxxx"
DEBUG Time elapsed per stage:
DEBUG     Infrastructure: 7m28s
DEBUG Bootstrap Complete: 11m6s
DEBUG  Bootstrap Destroy: 1m21s
DEBUG  Cluster Operators: 12m28s
INFO Time elapsed: 32m38s

#Cluster was created successfully.
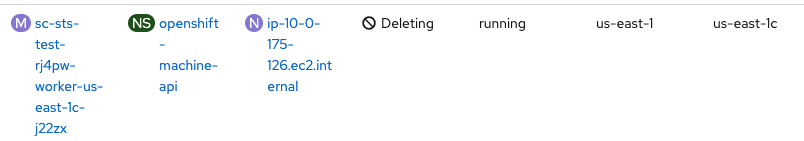
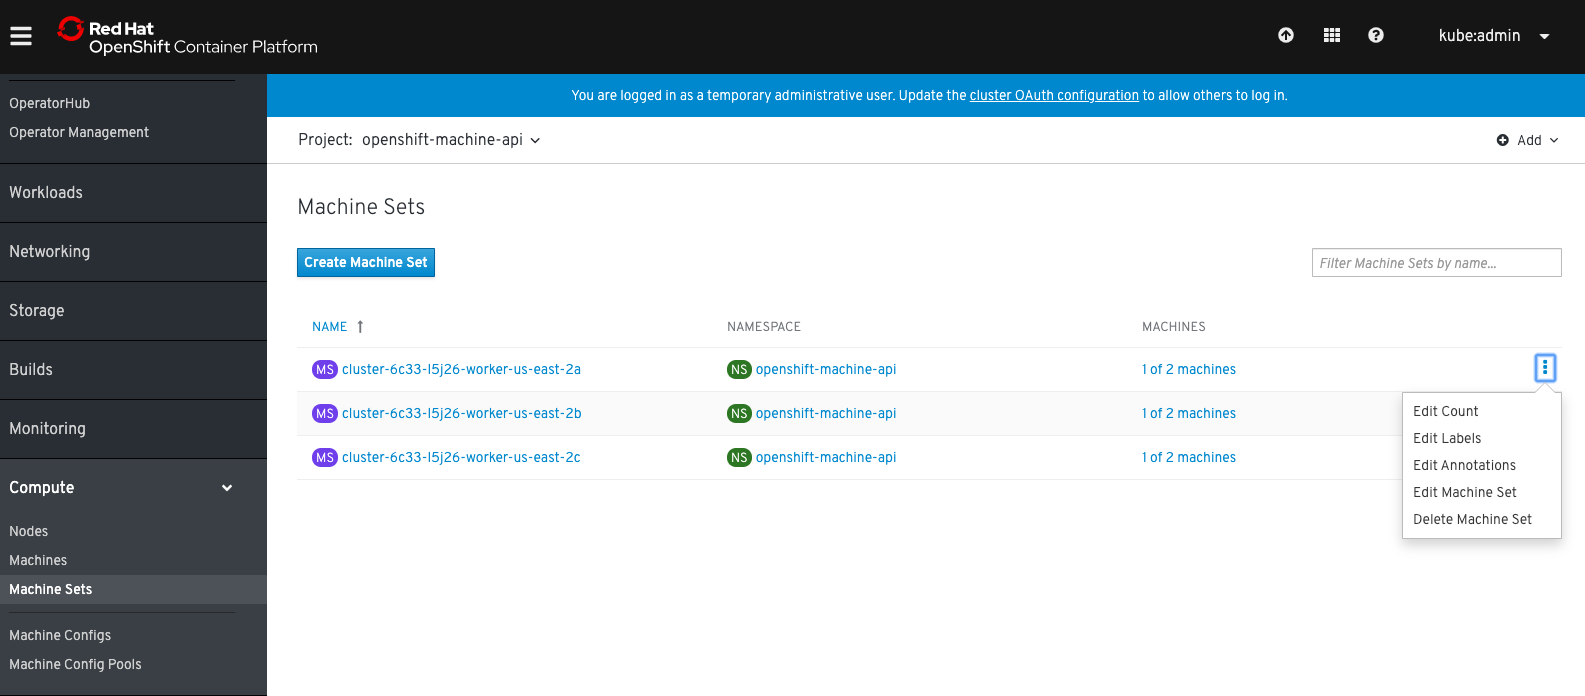
Increase the count from one of the MachineSets from Administrator console, worker node was able to provisioned.Decrease the count from one of the MachineSets from Administrator console, worker node was deleted.
Delete the Cluster
Obtain a new temporary credential:
cd <sts-preflight directory>
# ./sts-preflight token
2021/04/29 08:19:01 Token written to _output/token

# ./sts-preflight assume
Run these commands to use the STS credentials
export AWS_ACCESS_KEY_ID=<temporary key>
export AWS_SECRET_ACCESS_KEY=<temporary secret>
export AWS_SESSION_TOKEN=<session token>
Export all AWS environment variables using the result output from last step
Delete the cluster:
# ./openshift-install destroy cluster --log-level=debug --dir=./sc-sts-test
DEBUG OpenShift Installer 4.7.9
DEBUG Built from commit fae650e24e7036b333b2b2d9dfb5a08a29cd07b1
INFO Credentials loaded from default AWS environment variables
DEBUG search for matching resources by tag in us-east-1 matching aws.Filter{"kubernetes.io/cluster/sc-sts-rj4pw":"owned"}
...
INFO Deleted                                       id=vpc-0bbacb9858fe280f9
INFO Deleted                                       id=dopt-071e7bf4cfcc86ad6
DEBUG search for matching resources by tag in us-east-1 matching aws.Filter{"kubernetes.io/cluster/sc-sts-test-rj4pw":"owned"}
DEBUG search for matching resources by tag in us-east-1 matching aws.Filter{"openshiftClusterID":"ab9baacf-a44f-47e8-8096-25df62c3b1dc"}
DEBUG no deletions from us-east-1, removing client
DEBUG search for IAM roles
DEBUG search for IAM users
DEBUG search for IAM instance profiles
DEBUG Search for and remove tags in us-east-1 matching kubernetes.io/cluster/sc-sts-test-rj4pw: shared
DEBUG No matches in us-east-1 for kubernetes.io/cluster/sc-sts-test-rj4pw: shared, removing client
DEBUG Purging asset "Metadata" from disk
DEBUG Purging asset "Master Ignition Customization Check" from disk
DEBUG Purging asset "Worker Ignition Customization Check" from disk
DEBUG Purging asset "Terraform Variables" from disk
DEBUG Purging asset "Kubeconfig Admin Client" from disk
DEBUG Purging asset "Kubeadmin Password" from disk
DEBUG Purging asset "Certificate (journal-gatewayd)" from disk
DEBUG Purging asset "Cluster" from disk
INFO Time elapsed: 4m39s
I have previously blogged about the pre-GA ROSA, and now it is GA. I decided to write up my GA experience on ROSA.
Let’s get started here.
Enable ROSA on AWS
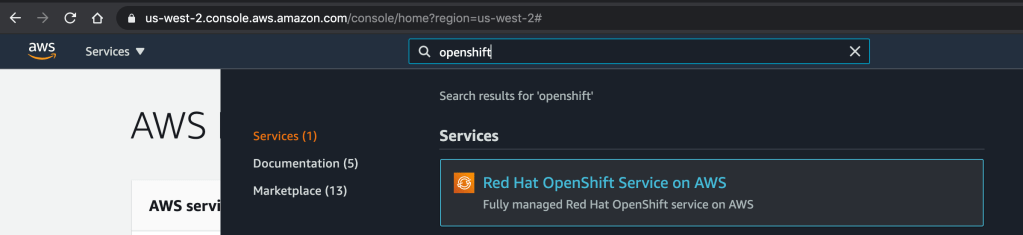
After logging into AWS, enter openshift in the search box on the top of the page.
Click on the “Red Hat OpenShift Service on AWS” Service listed.
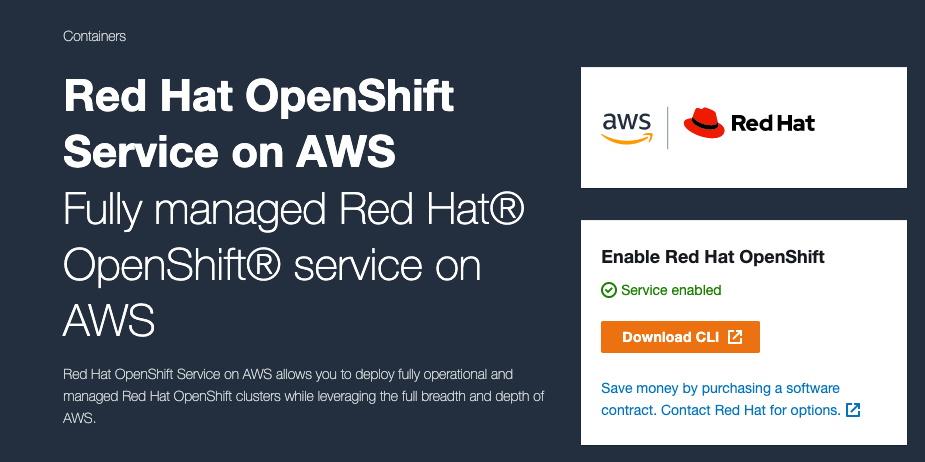
It will then take you to a page as shown below and click to enable the OpenShift service.
Once it is complete, it will show Service enabled.
Click to download the CLI and click on the OS where you run your ROSA CLI. It will start downloading to your local drive.
Set up ROSA CLI
Extract the downloaded CLI file and rosa add to your local path.
tar zxf rosa-macosx.tar.gz
mv rosa /usr/local/bin/rosa
Setting AWS Account
I have set up my AWS account as my IAM user account with proper access per the documentation. There is more information about the account access requirements for ROSA. It is available here.
I have configured my AWS key and secret in my .aws/credentials.
Create Cluster
Verify AWS account access.
rosa verify permissions
Returns:
I: Validating SCP policies...
I: AWS SCP policies ok
Verify the quota for the AWS account.
rosa verify quota --region=us-west-2
Returns:
I: Validating AWS quota...
I: AWS quota ok
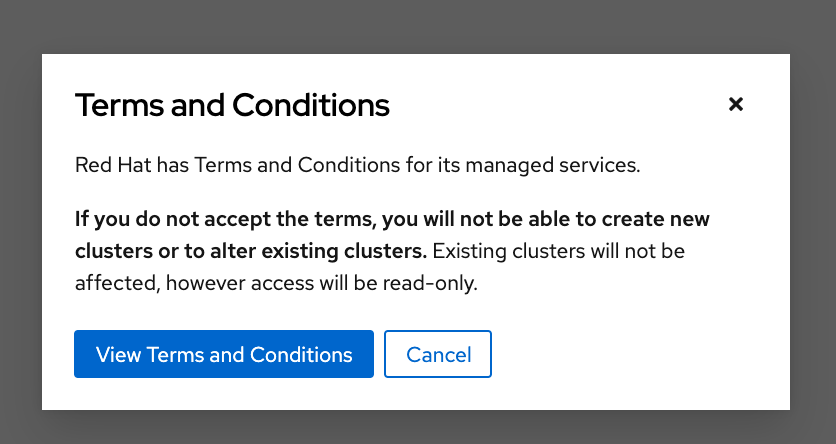
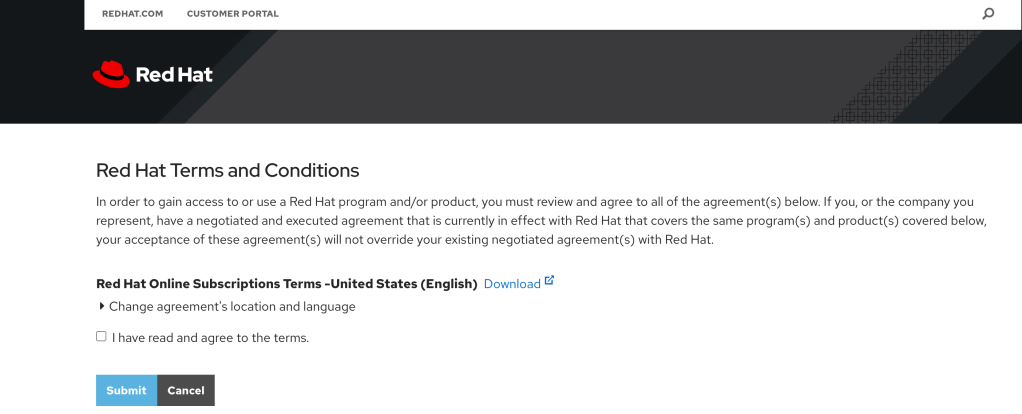
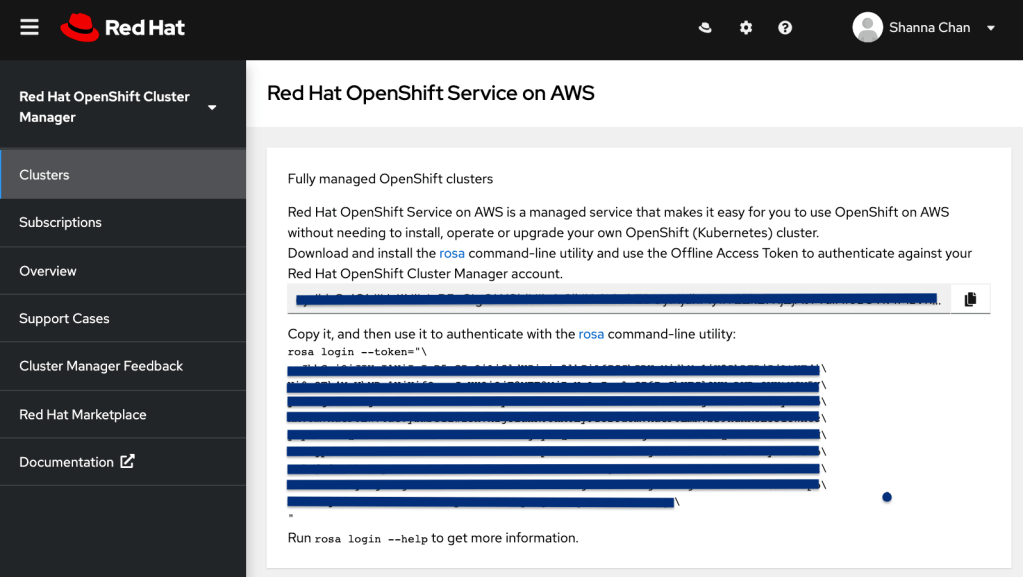
Obtain Offline Access Token from the management portal cloud.redhat.com (if you don’t have one yet) by clicking Create One Now link
Check the box to agree the terms and click Submit.
Copy the token from cloud.redhat.com.
rosa login --token=<your cloud.redhat.com token>
Returns:
I: Logged in as 'your_username' on 'https://api.openshift.com'
Verify the login
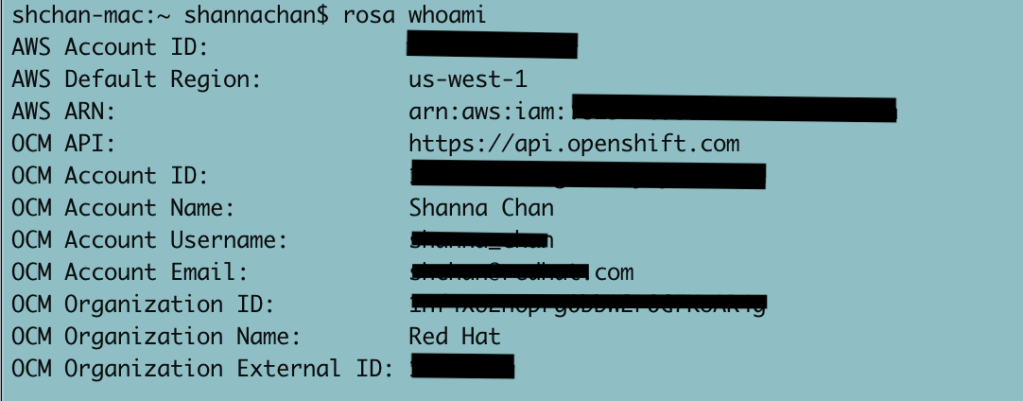
rosa whoami
Returns:
AWS Account ID:               ############
AWS Default Region:           us-west-2
AWS ARN:                      arn:aws:iam::############:user/username
OCM API:                      https://api.openshift.com
OCM Account ID:               xxxxxyyyyyzzzzzwwwwwxxxxxx
OCM Account Name:             User Name
OCM Account Username:         User Name
OCM Account Email:            name@email.com
OCM Organization ID:          xxxxxyyyyyzzzzzwwwwwxxxxxx
OCM Organization Name:        company name
OCM Organization External ID: 11111111
Configure account and make sure everyone setup correctly
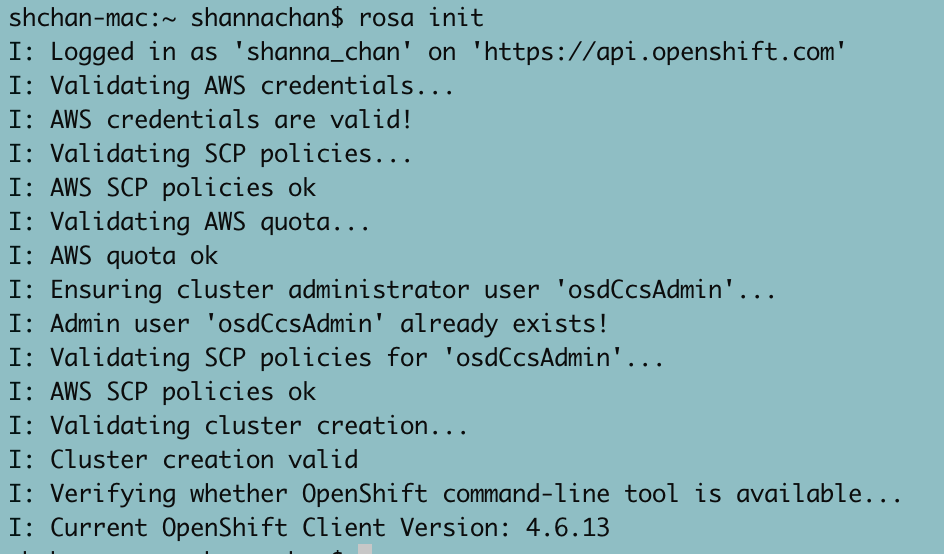
rosa init
Returns
I: Logged in as 'your_username' on 'https://api.openshift.com'
I: Validating AWS credentials...
I: AWS credentials are valid!
I: Validating SCP policies...
I: AWS SCP policies ok
I: Validating AWS quota...
I: AWS quota ok
I: Ensuring cluster administrator user 'osdCcsAdmin'...
I: Admin user 'osdCcsAdmin' already exists!
I: Validating SCP policies for 'osdCcsAdmin'...
I: AWS SCP policies ok
I: Validating cluster creation...
I: Cluster creation valid
I: Verifying whether OpenShift command-line tool is available...
I: Current OpenShift Client Version: 4.7.2
Creating cluster using interactive mode.
rosa create cluster -i
I: Interactive mode enabled.
Any optional fields can be left empty and a default will be selected.
? Cluster name: [? for help]
Enter the name of the ROSA cluster.
? Multiple availability zones (optional): [? for help] (y/N)
Enter y/N.
? AWS region:  [Use arrows to move, type to filter, ? for more help]
  eu-west-2
  eu-west-3
  sa-east-1
  us-east-1
  us-east-2
  us-west-1
> us-west-2
Select the AWS region and hit <enter>.
? OpenShift version:  [Use arrows to move, type to filter, ? for more help]
> 4.7.2
  4.7.1
  4.7.0
  4.6.8
  4.6.6
  4.6.4
  4.6.3
Select the version and hit <enter>.
? Install into an existing VPC (optional): [? for help] (y/N)
Enter y/N.
? Compute nodes instance type (optional):  [Use arrows to move, type to filter, ? for more help]
> r5.xlarge
  m5.xlarge
  c5.2xlarge
  m5.2xlarge
  r5.2xlarge
  c5.4xlarge
  m5.4xlarge
Select the type and hit <enter>.
? Enable autoscaling (optional): [? for help] (y/N)
Enter y/N.
? Compute nodes: [? for help] (2)
Enter the numbers of workers to start.
? Machine CIDR: [? for help] (10.0.0.0/16)
Enter the machine CIDR or use default.
? Service CIDR: [? for help] (172.30.0.0/16)
Enter the service CIDR or use default.
? Pod CIDR: [? for help] (10.128.0.0/14)
Enter the pod CIDR or use default.
? Host prefix: [? for help] (23)
Enter the host prefix or use default
? Private cluster (optional): (y/N)
Enter y/N.
Note:
Restrict master API endpoint and application routes to direct, private connectivity. You will not be able to access your cluster until you edit network settings in your cloud provider. I also learned that you would need one private subnet and one public subnet for each AZ for your existing private VPC for the GA version of ROSA. There will be more improvement to provide for the private cluster in the future release.
Returns:
I: Creating cluster 'rosa-c1'
I: To create this cluster again in the future, you can run:
   rosa create cluster --cluster-name rosa-c1 --region us-west-2 --version 4.7.2 --compute-nodes 2 --machine-cidr 10.0.0.0/16 --service-cidr 172.30.0.0/16 --pod-cidr 10.128.0.0/14 --host-prefix 23
I: To view a list of clusters and their status, run 'rosa list clusters'
I: Cluster 'rosa-c1' has been created.
I: Once the cluster is installed you will need to add an Identity Provider before you can login into the cluster. See 'rosa create idp --help' for more information.
I: To determine when your cluster is Ready, run 'rosa describe cluster -c rosa-c1'.
I: To watch your cluster installation logs, run 'rosa logs install -c rosa-c1 --watch'.
Name:                       rosa-c1
ID:                         xxxxxxxxxxyyyyyyyyyyyaxxxxxxxxx
External ID:
OpenShift Version:
Channel Group:              stable
DNS:                        rosa-c1.xxxx.p1.openshiftapps.com
AWS Account:                xxxxxxxxxxxx
API URL:
Console URL:
Region:                     us-west-2
Multi-AZ:                   false
Nodes:
 - Master:                  3
 - Infra:                   2
 - Compute:                 2 (m5.xlarge)
Network:
 - Service CIDR:            172.30.0.0/16
 - Machine CIDR:            10.0.0.0/16
 - Pod CIDR:                10.128.0.0/14
 - Host Prefix:             /23
State:                      pending (Preparing account)
Private:                    No
Created:                    Mar 30 2021 03:10:25 UTC
Details Page:               https://cloud.redhat.com/openshift/details/xxxxxxxxxxyyyyyyyyyyyaxxxxxxxxx
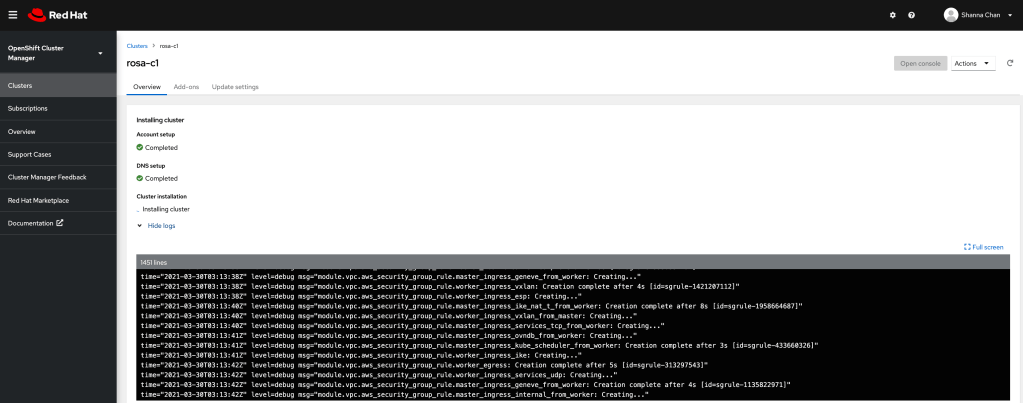
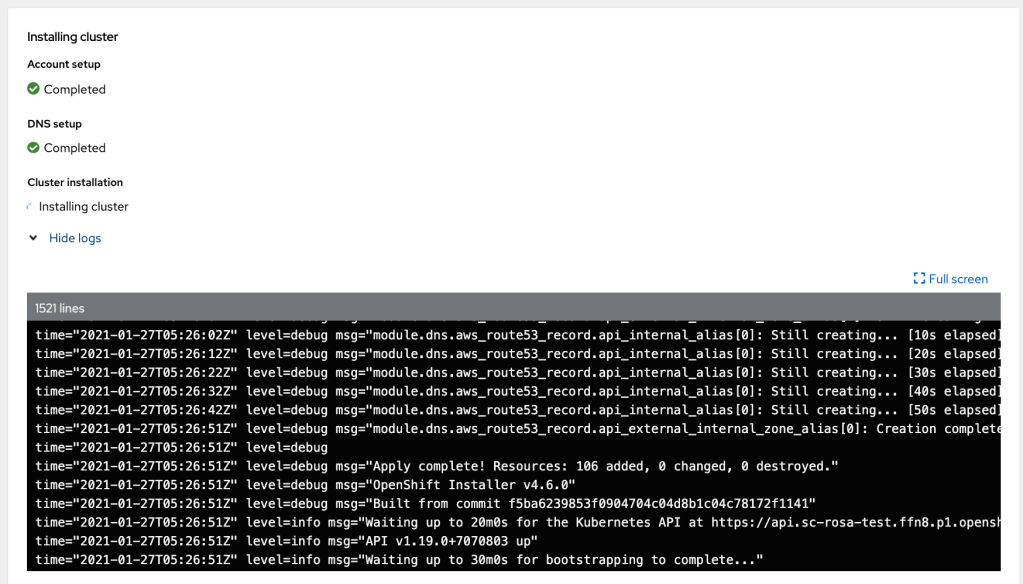
Copy the URL from the Details Page to the browser and click view logs to see the status of the installation.
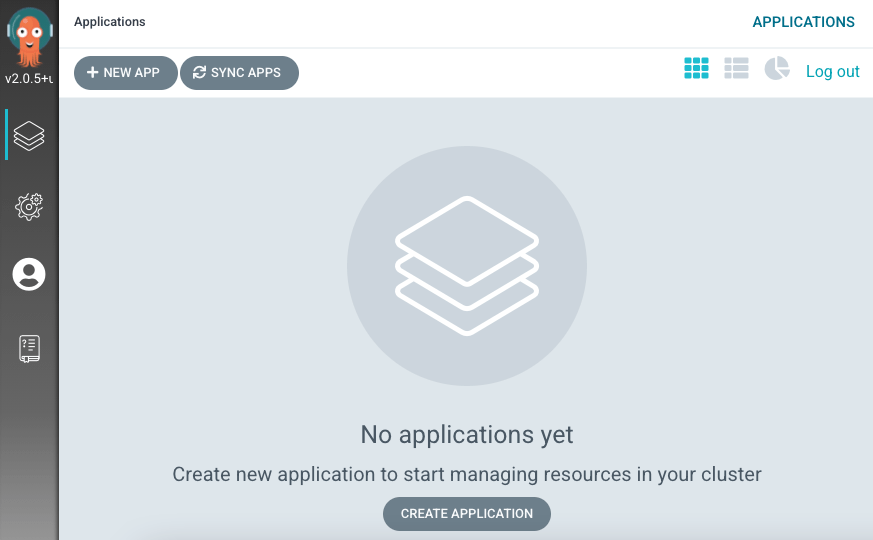
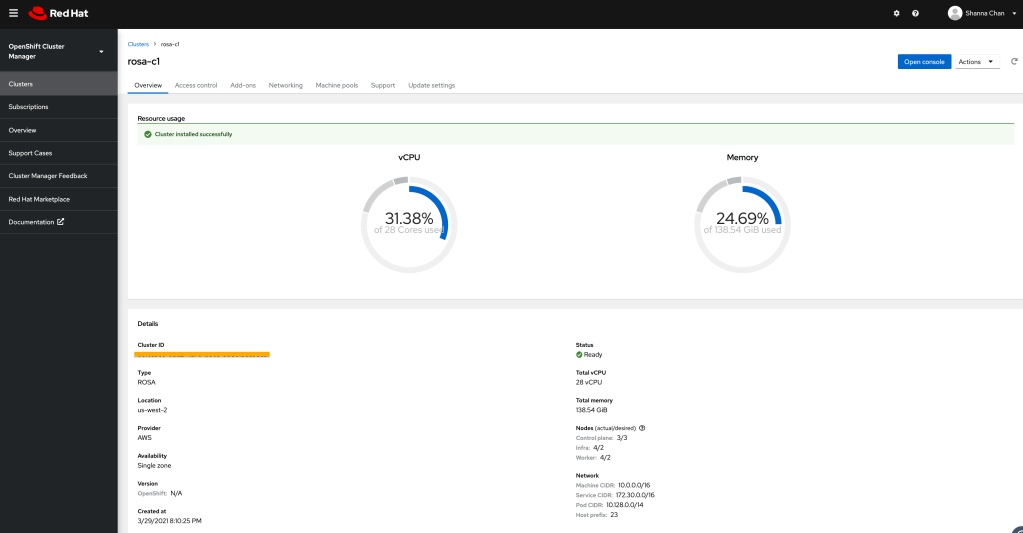
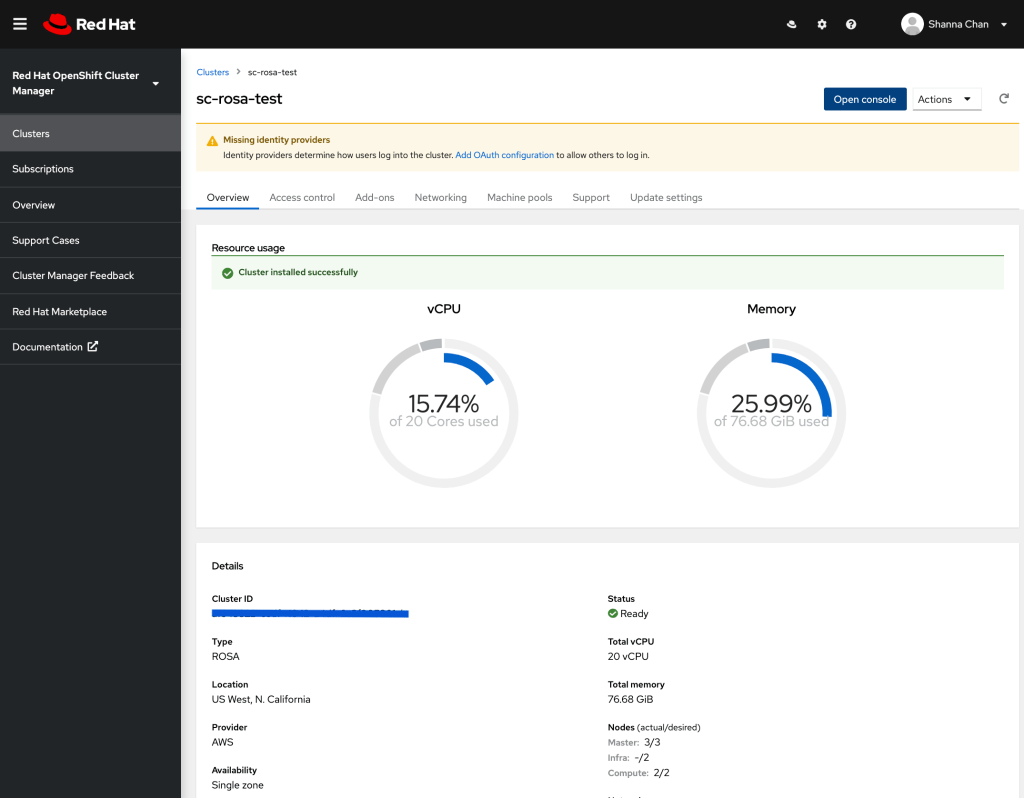
When ROSA is completed, you will see the similar page as below.
You will need to access the OpenShift cluster.
Configure Quick Access
Add cluster-admin user
rosa create admin -c rosa-c1
Returns:
I: Admin account has been added to cluster 'rosa-c1'.
I: Please securely store this generated password. If you lose this password you can delete and recreate the cluster admin user.
I: To login, run the following command:

   oc login https://api.rosa-c1.xxxx.p1.openshiftapps.com:6443 --username cluster-admin --password xxxxx-xxxxx-xxxxx-xxxxx

I: It may take up to a minute for the account to become active.
Test user access
$ oc login https://api.rosa-c1.xxxx.p1.openshiftapps.com:6443 --username cluster-admin --password xxxxx-xxxxx-xxxxx-xxxxx
Login successful.

You have access to 86 projects, the list has been suppressed. You can list all projects with 'oc projects'

Using project "default".
Configure Identity Provider
There are options for identity providers. I am using Github in this example.
I am not going to explain how to get identity to provide set up here. I did that in last blog. I will walk through the step to configure ROSA using Github.
rosa create idp --cluster=rosa-c1 -i
I: Interactive mode enabled.
Any optional fields can be left empty and a default will be selected.
? Type of identity provider:  [Use arrows to move, type to filter]
> github
  gitlab
  google
  ldap
  openid
Select one IDP
? Identity provider name: [? for help] (github-1)
Enter the name of the IDP configured on the ROSA
? Restrict to members of:  [Use arrows to move, type to filter, ? for more help]
> organizations
  teams
Select organizations
? GitHub organizations:
Enter the name of the organization. My example is `sc-rosa-idp`
? To use GitHub as an identity provider, you must first register the application:
  - Open the following URL:
    https://github.com/organizations/sc-rosa-idp/settings/applications/new?oauth_application%5Bcallback_url%5D=https%3A%2F%2Foauth-openshift.apps.rosa-c1.0z3w.p1.openshiftapps.com%2Foauth2callback%2Fgithub-1&oauth_application%5Bname%5D=rosa-c1&oauth_application%5Burl%5D=https%3A%2F%2Fconsole-openshift-console.apps.rosa-c1.0z3w.p1.openshiftapps.com
  - Click on 'Register application'
Open a browser and use the above URL to register the application and cope client ID
? Client ID: [? for help]
Enter the copied Client ID
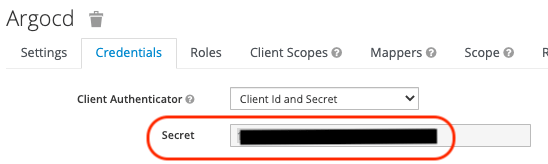
? Client Secret: [? for help]
Enter client secret from the registered application.
? GitHub Enterprise Hostname (optional): [? for help]
Hit <enter>
? Mapping method:  [Use arrows to move, type to filter, ? for more help]
  add
> claim
  generate
  lookup
Select claim
I: Configuring IDP for cluster 'rosa-c1'
I: Identity Provider 'github-1' has been created.
It will take up to 1 minute for this configuration to be enabled.
To add cluster administrators, see 'rosa create user --help'.
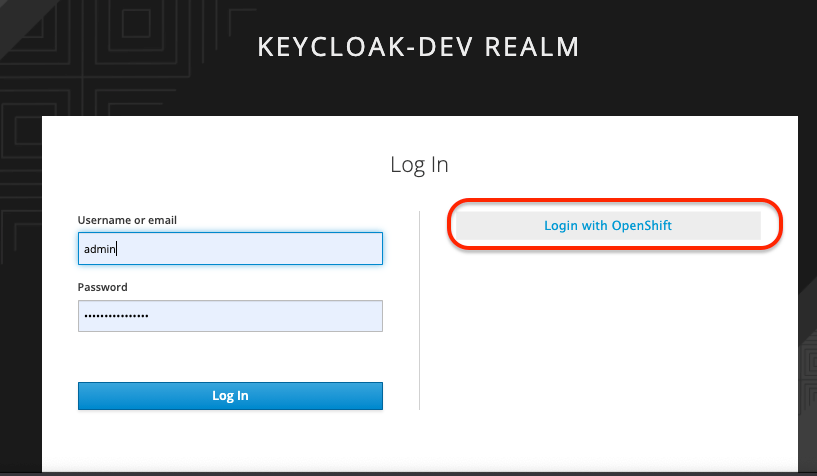
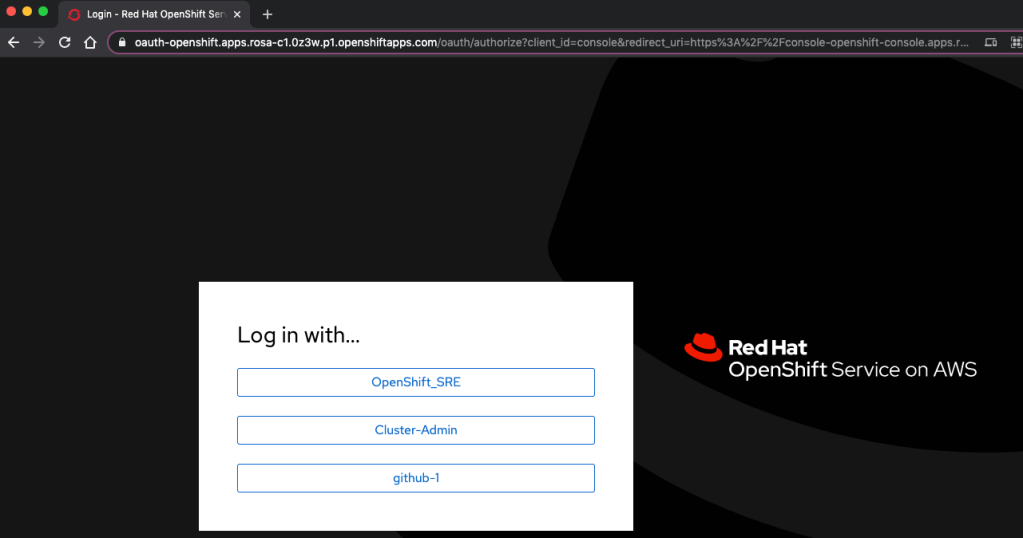
To login into the console, open https://console-openshift-console.apps.rosa-c1.xxxx.p1.openshiftapps.com and click on github-1.
I have an opportunity to try out the pre-GA ROSA. ROSA is a fully managed Red Hat OpenShift Container Platform (OCP) as a service and sold by AWS. I am excited to share my experience on ROSA. It installs OCP 4 from soup to nuts without configuring hosted zone and domain sever. As a developer, you may want to get the cluster up and running, so you can start doing the real work :). There are customization options with ROSA, but I am going to leave it for later exploration.
I am going to show you the steps I took to create OCP via ROSA. There are more use cases to test. I hope this blog will give you a taste of ROSA.
Creating OpenShift Cluster using ROSA Command
Since it is a pre-GA version, I download the ROSA command line tool from the here and have aws-cli available where I run the ROSA installation.
I am testing from my MacBook. I just move the “rosa” command line tool to /usr/local/bin/.
Verify that your AWS account if it has the necessary permissions using rosa verify permissions:
Verify that your AWS account has the necessary quota to deploy an Red Hat OpenShift Service on AWS cluster via rosa verify quota --region=<region>:
You will need an account to log in to cloud.redhat.com. If you don’t have a user name created, please register as a user for free.
Log in your Red Hat account with ROSA command using rosa login --token=<token from cloud.redhat.com>:
Verify the AWS setup using rosa whoami:
Initialize the AWS for the cluster deploy via rosa init:
Since I have OpenShift Client command line installed, it shows the existing OpenShift Client version. If you don’t have it, you can download the OpenShift Client command line via rosa download oc and make it available from your PATH.
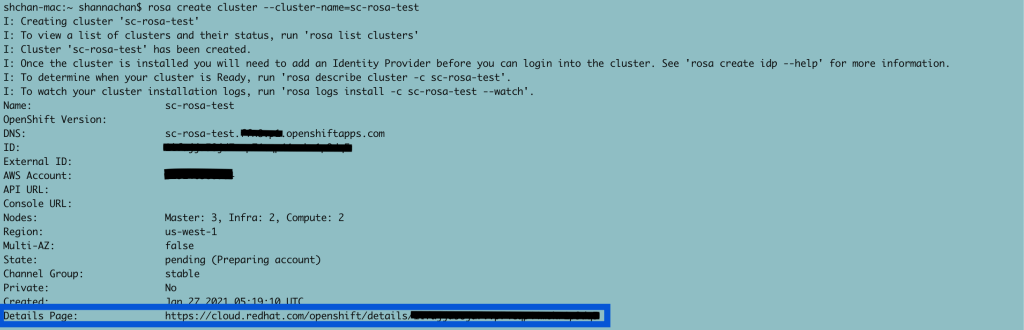
Create ROSA via rosa create cluster command below:
Note: rosa create cluster -i with the interactive option, it provides customization for ROSA installation, such as multiple AZ, existing VPC, subnets, etc…
Copy the URL from Details Page to a browser and you can view the status for your ROSA installation.
If you click View logs, you can watch the log from here until the cluster is completed.
When you see this screen, it means the cluster is created:
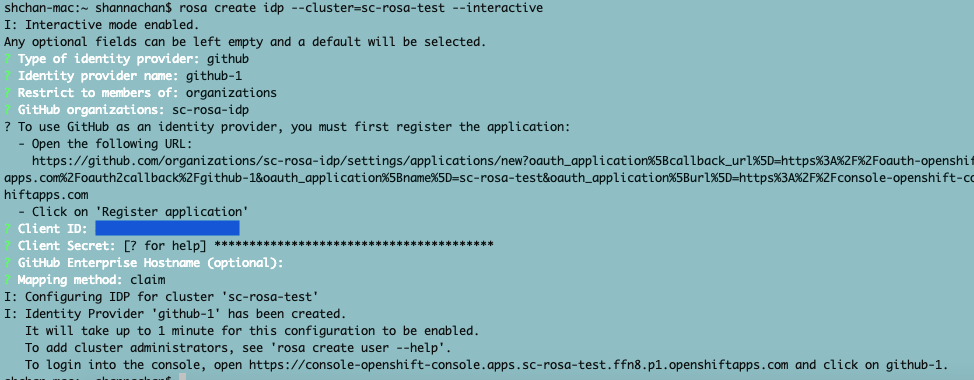
Now, you need to have a way to log into the OCP cluster. I created an organization called sc-rosa-idp on Github via rosa create idp --cluster=sc-rosa-test --interactive as show below.
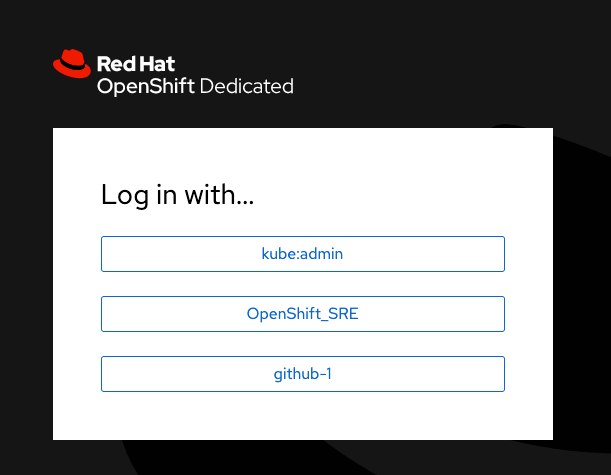
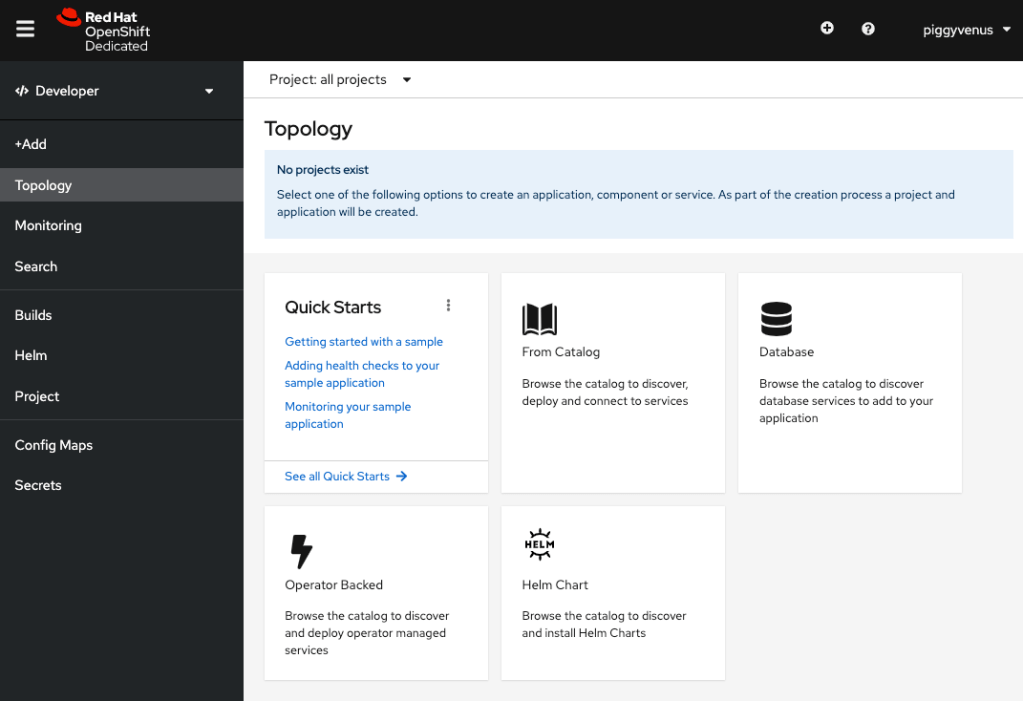
Log into the OCP console via the URL from the output from last step:
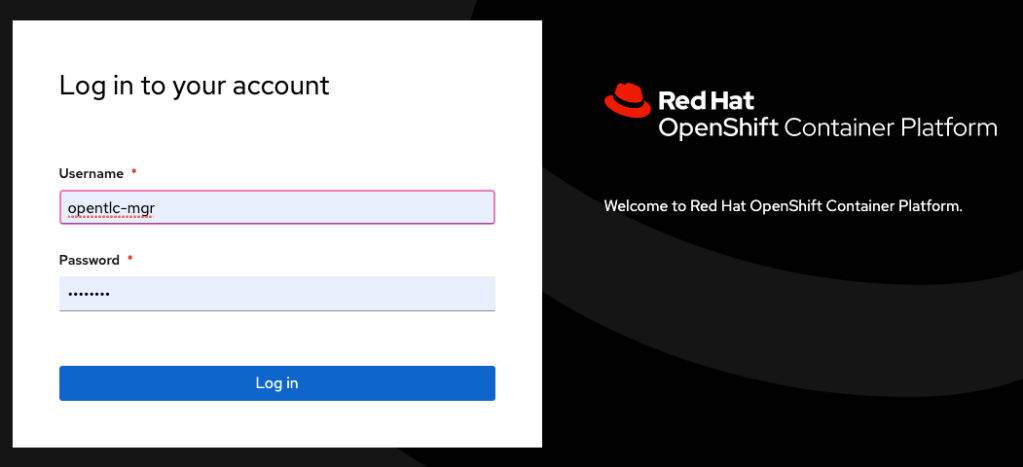
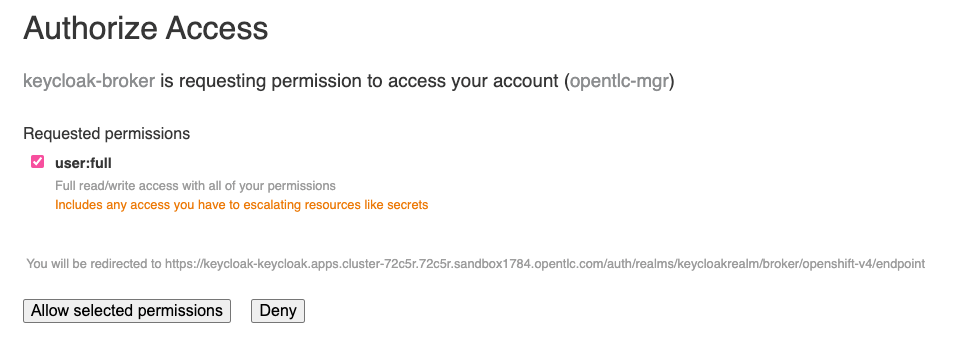
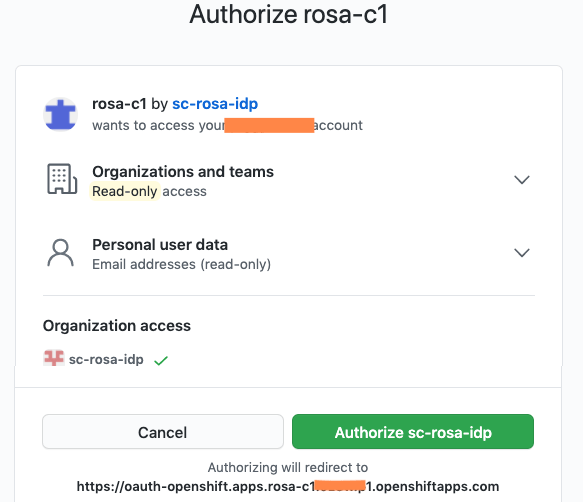
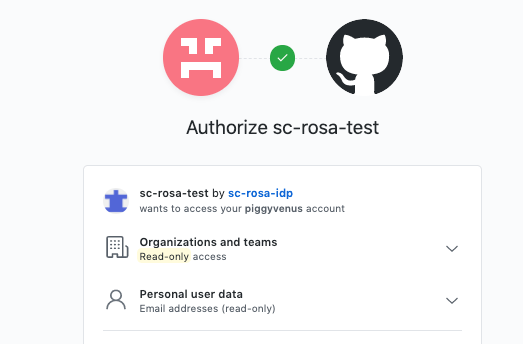
Click github-1 –> redirect to authorize to the organization from Github -> log in Github.
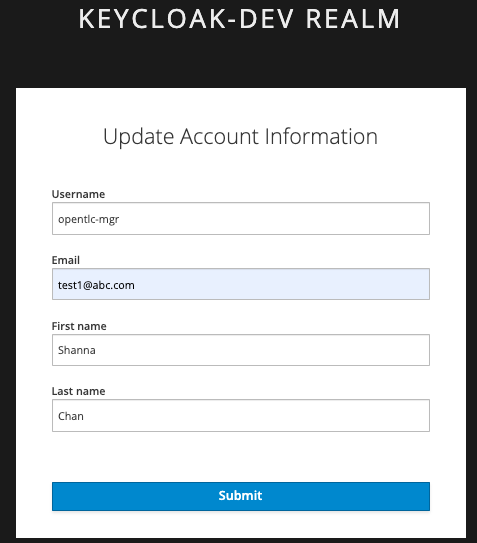
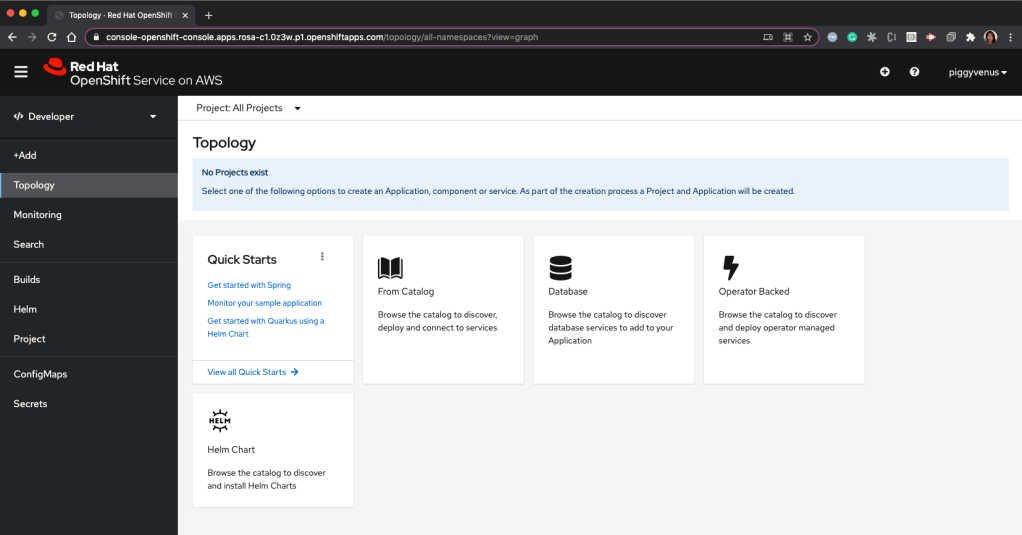
Once you log in with your Github credential, we will see the OCP developer console:
Grant cluster-admin role to the github user using rosa grant user cluster-admin --user <github user in your organization> --cluster <name of your rosa cluster>.
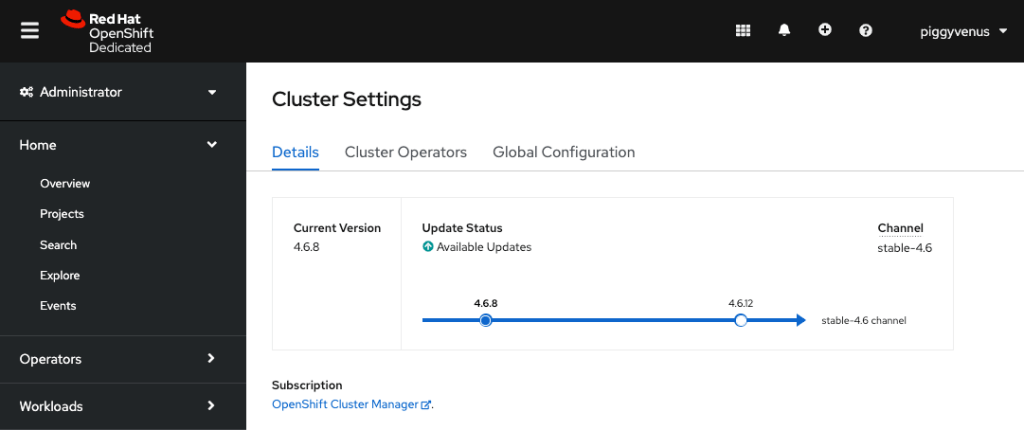
Click Administrator on the top left and access the OCP admin console with Admin access as shown below:
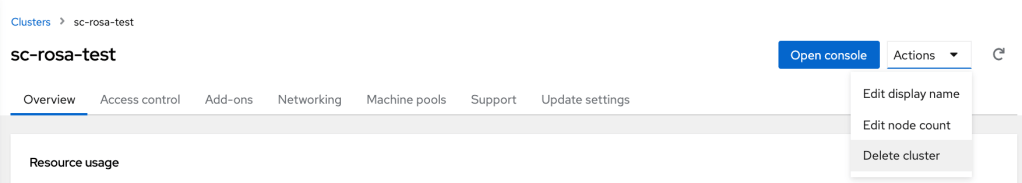
Delete ROSA
Go to the cluster from cloud.redhat.com, from Action –> select Delete cluster:
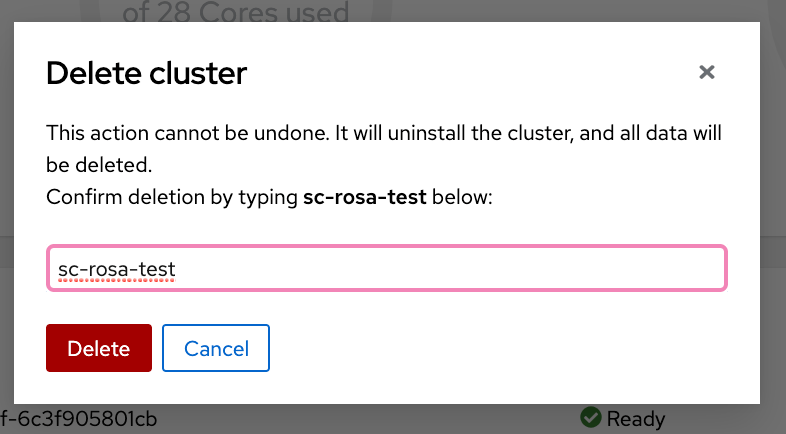
Enter the name of the cluster and click Delete:
The cluster shows as Uninstalling:
Although it is a pre-GA without AWS console integration, I found it very easy to get my cluster up and running. If you cannot wait for GA, you can always request the preview access from here. Get a head start with ROSA!
In my last post on ARO 4, I have already walk through the steps to set up the Azure environment for creating ARO 4. My 2nd round testing requires the following specific requirements:
Use only one app registration
Not to use pull secret
You will need to complete the session for setting up Azure environment in my previous blog for ARO 4.
Create ARO 4 Cluster with existing service principal
Create a service principal
From the previous test, I learned that the process of creating ARO 4 will create a service principal. I am going to create a service principal before creating cluster.
$ az ad sp create-for-rbac --role Contributor --name all-in-one-sp
This command will return the appId and password information that we will need for the ARO 4 create command later.
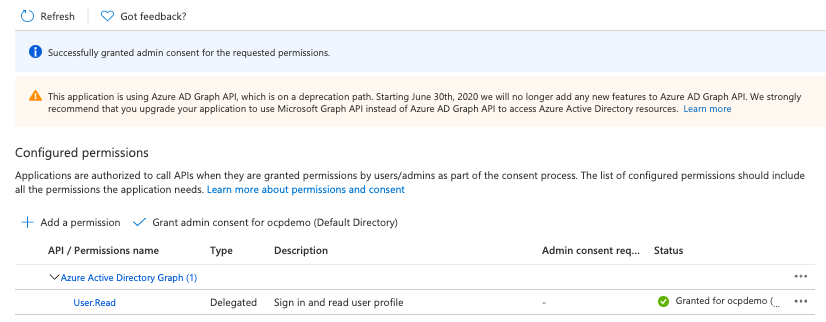
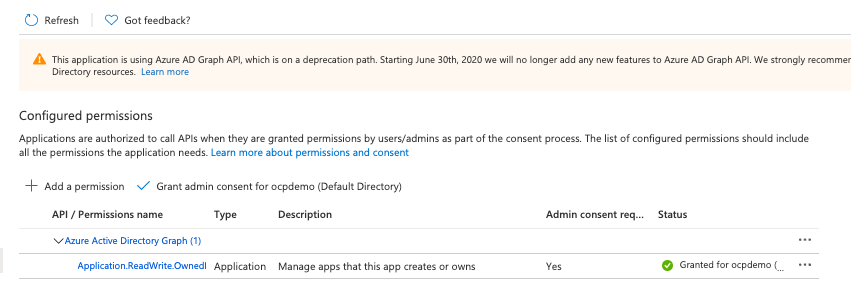
Adding API permission to the service principal
Login to Azure Portal
Go to Azure Active Directory
Click App registrations
Click “All applications”
Search for “app-in-one-sp”
Click “View API permission”
Click “Add a permission”
Click “Azure Active Directory Graph”
Click “Delegated Permissions”
Check “User.Read”
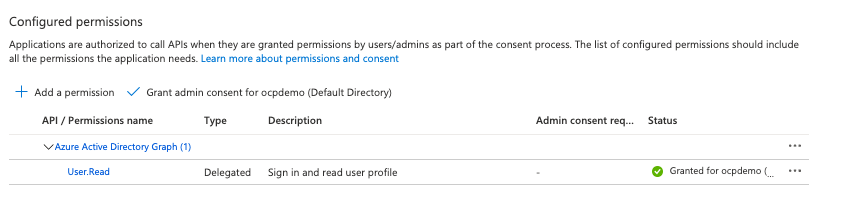
Click “Add permission” button at the bottom.
Click “Grant admin consent …”
A green check mark is shown under Status as shown below
Create ARO with existing service principal without pull secret
az aro create \
--resource-group $RESOURCEGROUP \
--name $CLUSTER \
--client-id <service principal application id> \
--client-secret <service principal password> \
--vnet aro-vnet \
--master-subnet master-subnet \
--worker-subnet worker-subnet \
--domain aro.ocpdemo.online
When I opted out the pull secret option, I will get the following message from the output of the azure cli.
No --pull-secret provided: cluster will not include samples or operators from Red Hat or from certified partners.
Adding api and ingress A record to the DNS zone
Using the output from the ARO 4 creation, Use the IP from the “apiserverProfile” portion is for api servier. The IP from “ingressProfiles” is for ingress. The example is shown below.
Test out the ARO cluster
az aro list-credentials \
--name $CLUSTER \
--resource-group $RESOURCEGROUP
Open the following URL from the browser and login using the kubeadmin with password from the above command
I happened to test out ARO 4 with Azure Active Directory integration. The Azure documentation is good, but I had to change a few while testing the steps. I am sharing my experience here and hope someone will find it useful.
Setting the requirements
Install or update Azure CLI
brew update && brew install azure-cli
Make sure you have permission to create resources in the resource group. I logged in as a global administrator when I am testing this.
Setup the environment variables
$ cat aro-env
LOCATION=centralus. # the location of your cluster
RESOURCEGROUP=aro-rg # the name of the resource group where you want to create your cluster
CLUSTER=poc #cluster-id of the ARO 4 cluster
$ source aro-env
Log in Azure
az login
Create a Resource Group
az group create \
--name $RESOURCEGROUP \
--location $LOCATION
Add DNS zone
If you don’t have a DNS zone already, you can use this step.
Login Azure Portal
Type: “DNS Zones” in the search box on the top and click on “DNS Zones”
Click “+Add” on the top
Select the newly created resource group
Enter your domain
Select the location
Create “Review+Create”
Notes:
I am using a domain name outside of the Azure. You will need to add the NS records from the overview page of the DNS zone to your domain.
Request increase of quota from Azure portal. ARO requires a minimum of 40 cores.
Register Resource Provider
az account set --subscription
az provider register -n Microsoft.RedHatOpenShift --wait
az provider register -n Microsoft.Compute --wait
az provider register -n Microsoft.Storage --wait
Once the above steps are done. You don’t have to redo the steps if you are going to reuse the names and resources.
Create Cluster
Please make sure you log in to Azure and environment variables are set.
Information that we need for creating a cluster
Get a copy of the pull secret from cloud.redhat.com. If you don’t have a user name created, please just register as a user for free.
Create an ARO cluster using the following command. Please apply to appropriate values. Some values were used in the example are explained as shown below.
aro-vnet – the name of virtual network
master-subnet – the name of master subnet
worker subnet – the name of worker subnet
./pull-secret.txt – the path and pull secret where is located
aro.ocpdemo.online – custom domain for the cluster
The information from the JSON output of the above command can be useful if you are not familiar with OpenShift 4. You can find your API server IP, API URL, OpenShift console URL and ingress IP. You will need the API, and ingress IP for the next step.
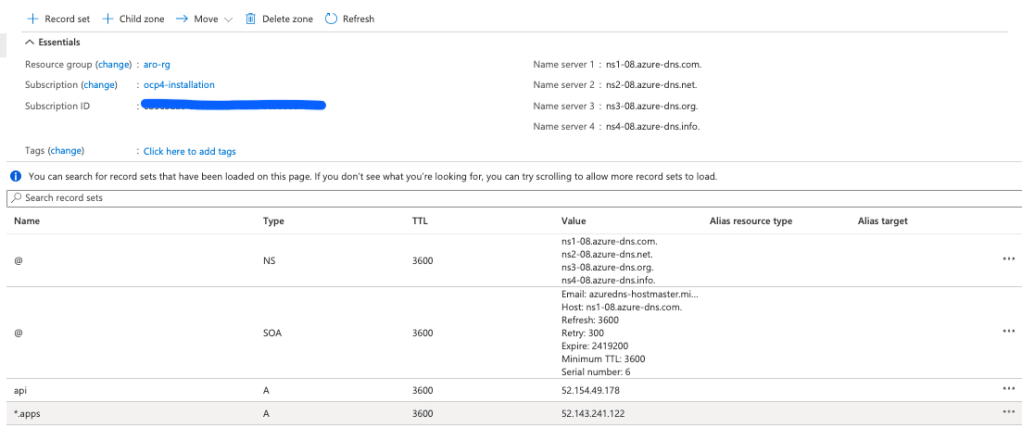
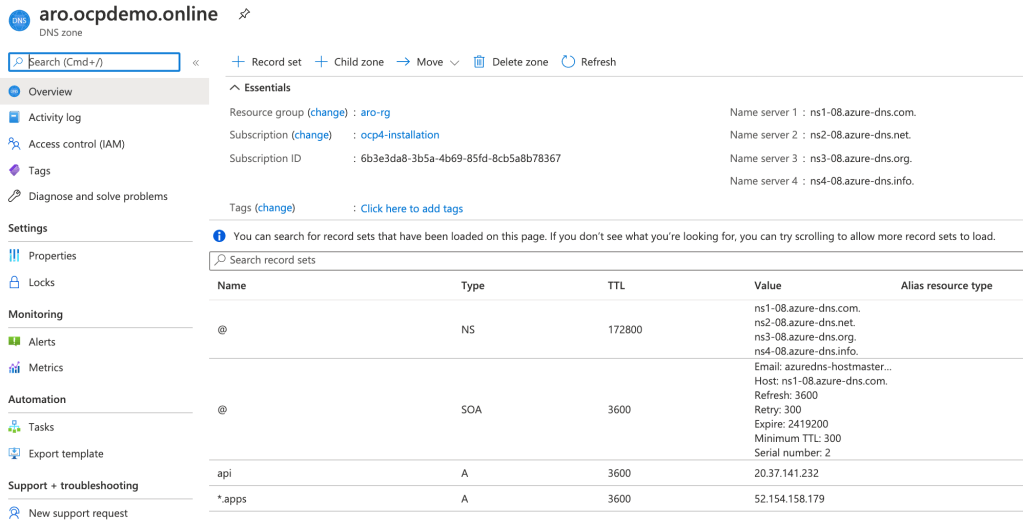
Adding two A records for api and *.apps in the DNS zone
Login to Azure portal
Go to DNS zone
Click onto the domain for the ARO cluster
Click “+ Record Set” on the top menu to create an A record and add values to Name and IP. You will need to repeat this step for both api and *.apps A records.
Name: api or *.apps
IP: the *.apps/ingress IP is from the output of the creation of the ARO
The below screenshot shows the DNS zone configuration and adding 2 A records.
Test ARO Cluster
Getting Kubeadmin credential
az aro list-credentials \
--name $CLUSTER \
--resource-group $RESOURCEGROUP
The command will return the kubeadmin credential.
Log in OpenShift Console
Open a browser and go to the OpenShift console or look for “consoleProfile” from the JSON output from ARO creation
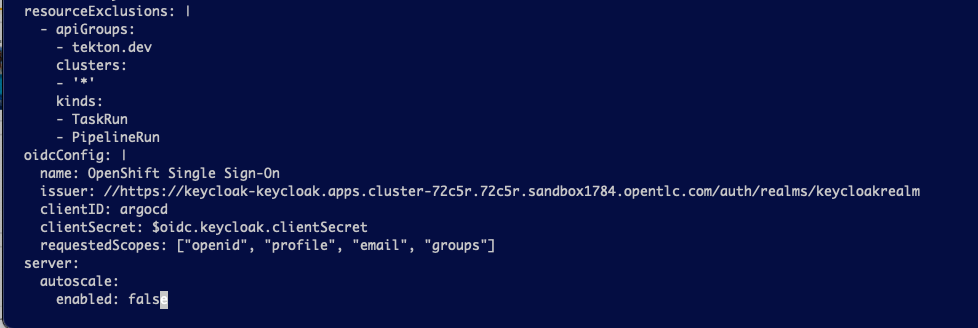
The clientSecret is using the secret (openid-client-secret-azuread) that you created from the previous step.
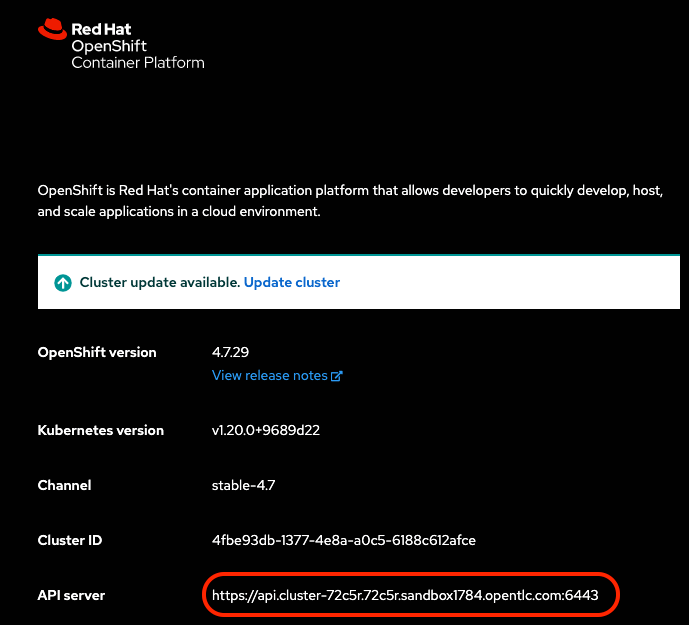
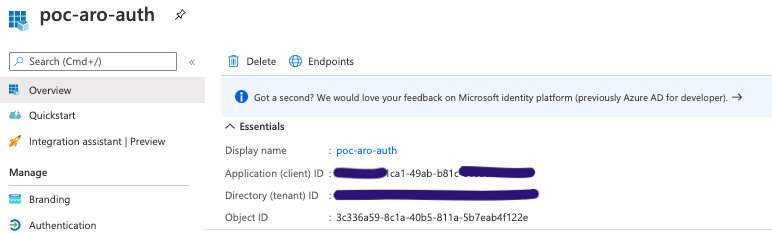
Alternatively, you can obtain the clientID and tenant id from Azure Portal.
Login Azure Portal
Click Home
Click Azure Active Directory
Click App registrations on the left menu
Click all applications tab
Type the application that you just created in the search area
Click onto the application (my application is poc-aro-auth)
Under Overview, the information is shown as “Application (client) ID” and Directory (tenant) ID” as in the image below.
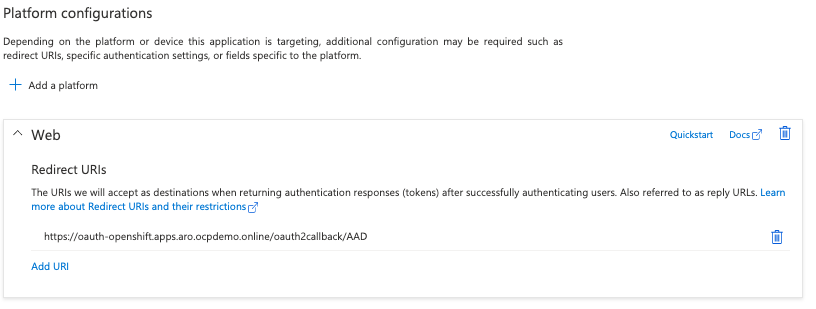
Update OpenShift OAuth Configuration
oc apply -f openid.yaml
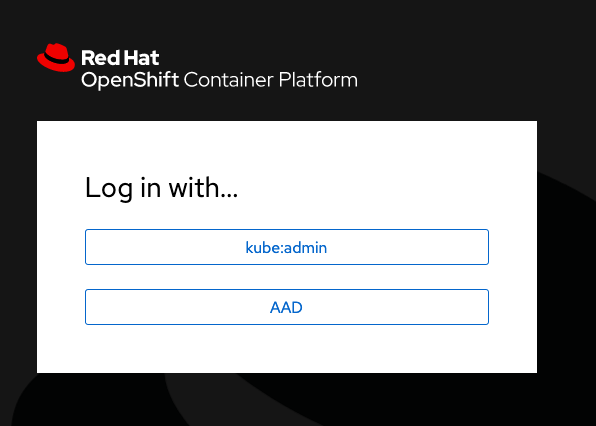
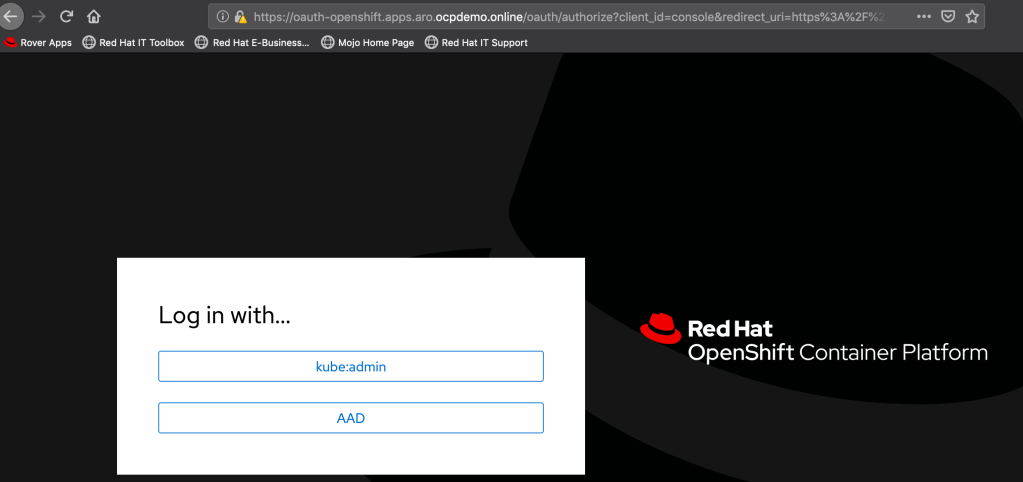
Login OpenShift console via AAD
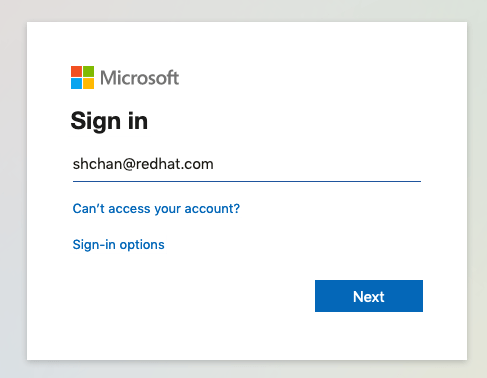
It will redirect you to Azure login page
Troubeshoot
Tip #1: If you are getting error, you can login as kubeadmin and check the logs from oauth-openshift pods under openshift-authentication project.
Tip #2: if you are creating a new registered application to try, make sure you clean up the user and identity.
My task is to figure out how to configure the Metering correlating AWS billing. The OpenShift documentation in the reference is where I started. I decided to record the end-to-end steps on how I set this up since there were some lessons learned in the process of it. I hope this helps you to set up the Metering with AWS billing much smoother.
Prerequisites:
Setting up AWS Report
Before creating anything, you need to have data in the Billing & Cost Management Dashboard already.
If you have a brand new account, you may have to wait until you get some data to show up before you proceed. You will have to have access to Cost & Usage Report under AWS Billing to set up the report.
Log in to AWS, go to My Billing Dashboard
Click Cost & Usage Reports
Click Create reports
Provide a name and check Include resource IDs
Click Next
Click Configure → add S3 bucket name and Region-> click Next
Provide `prefix` and select your options for your report → Click Next
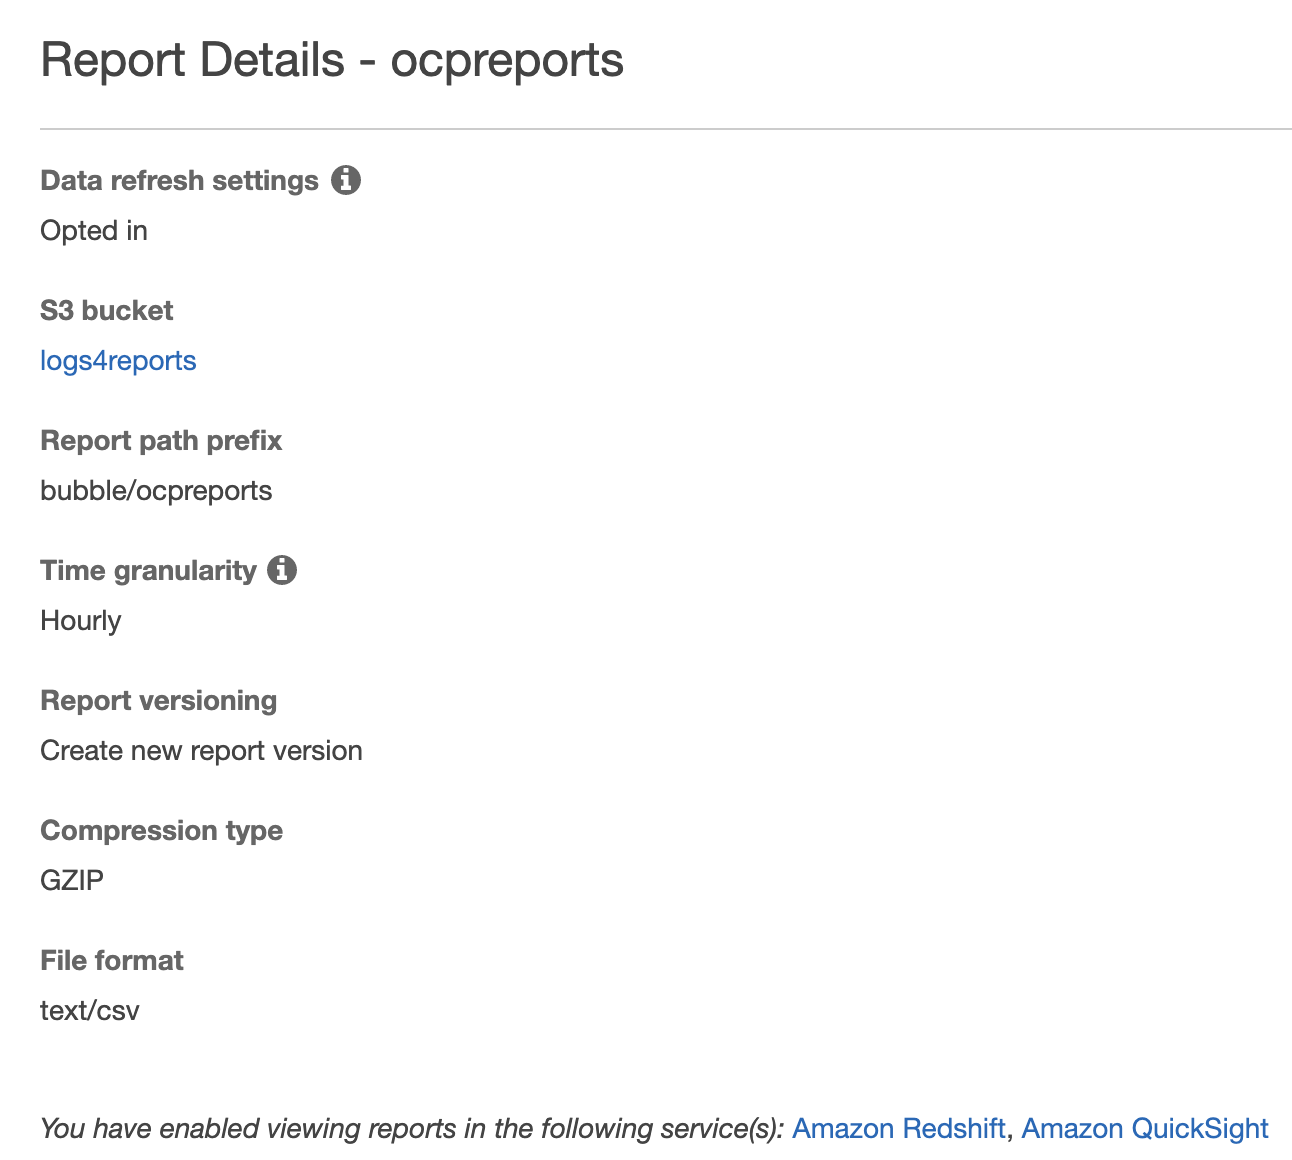
Once you created a report similar to the following
Click onto the S3 bucket and validate reports are being created under the folder.
Click Permissions tab
Click Bucket Policy
Copy and save the bucket policy somewhere you can get back to
Setting up AWS user permission policy
Go to My Security Credentials
Click Users → Click the username name will be used for accessing the reports and for OpenShift metering.
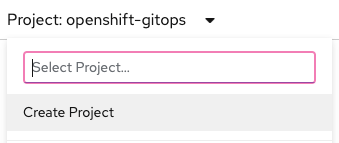
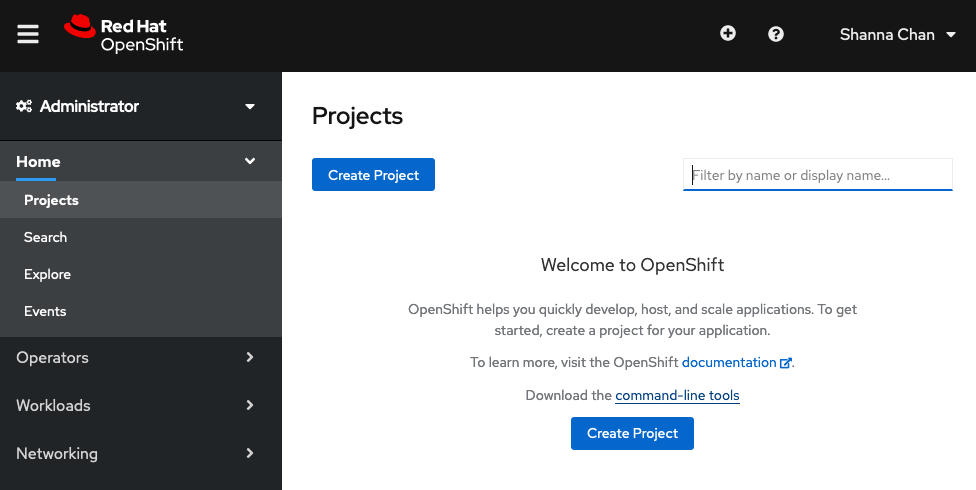
Login OpenShift Container Platform web console as cluster-admin, click Administration → Namespaces → Create Namespace
Enter openshift-metering
Add openshift.io/cluster-monitoring=true as label → click Create.
Click Compute→ Machine Sets
If you are like me, the cluster is using the default configuration on AWS. In my test, I increase 1 more worker per AZs.
I notice that one pod for Metering requires more resources, and the standard size may not be big enough. I create an m5.2xlarge machine set. I only need 1 replica for this machineset.
Modify the YAML file by updating the name of the machine set and instance type, removing the status, timestamp, id, selflink, etc… Here is my example of a machine set for m5.2xlarge.
Back to Console, click Operators → OperatorHub and type ‘metering` in the filter to find the Metering Operator.
Click the Metering (provided by Red Hat), review the package description, and then click install.
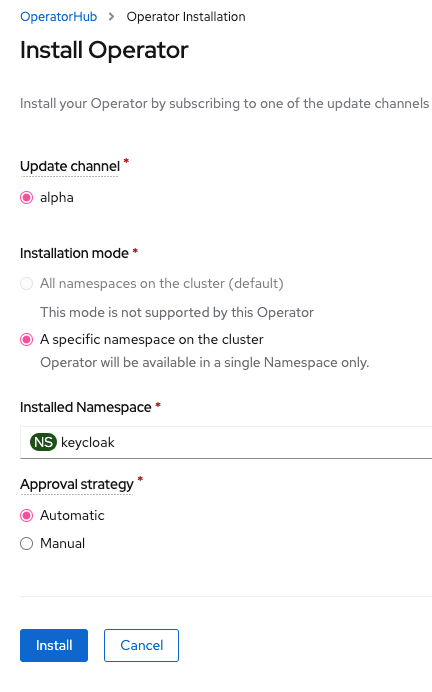
Under Installation Mode, select openshift-metering as namespace. Specify your update channel and approval strategy, then click Subscribe to install Metering.
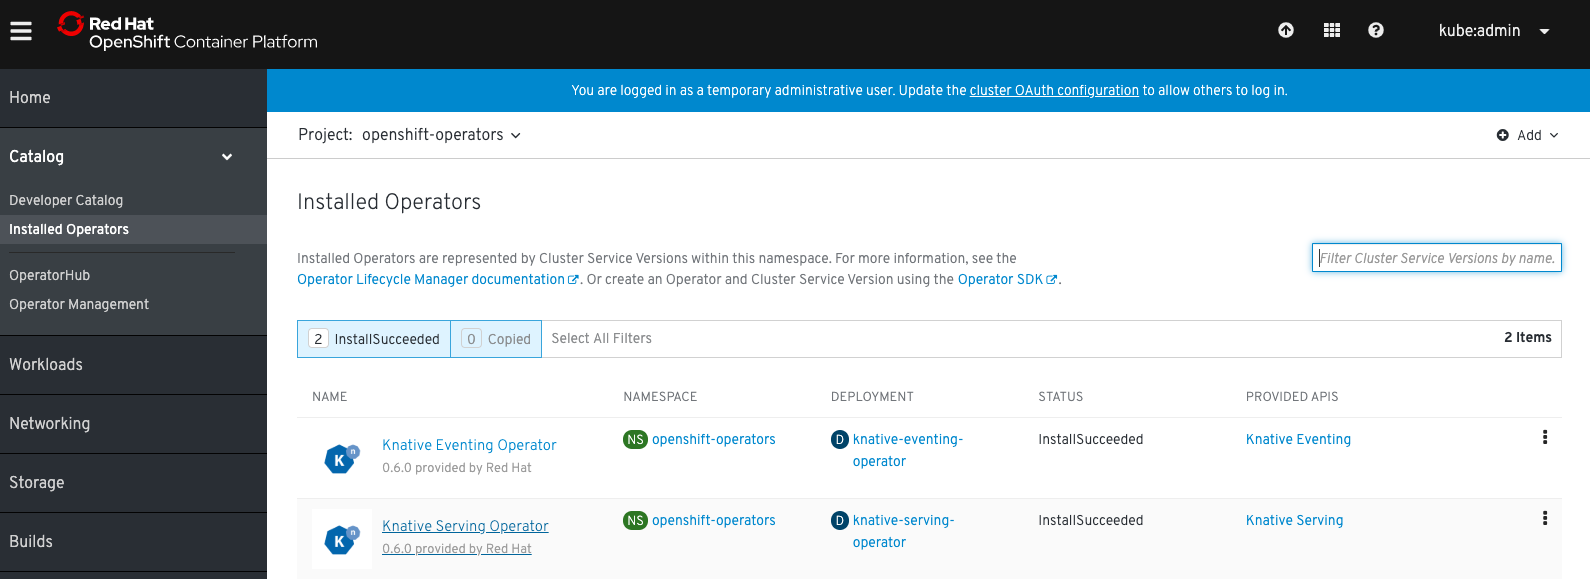
Click Installed Operators from the left menu, wait for Succeeded as status is shown next to the Metering Operator.
Click Workloads → Pods → metering operator pod is in Running state
Go back to your terminal, run:
oc project openshift-metering
We are now ready to create the MeteringConfig Object. Create a file `metering-config.yaml` as shown below. See the reference for more details of the MeteringConfig object.
$ oc create -f aws-reports.yaml
$ oc get reports
NAME                                  QUERY                    SCHEDULE   RUNNING          FAILED   LAST REPORT TIME   AGE
pod-cpu-request-billing-run-once      pod-cpu-request-aws                 RunImmediately                               5s
pod-memory-request-billing-run-once   pod-memory-request-aws              RunImmediately                               5s
Wait until reports are completed (status as `Finished`):
$ oc get reports
NAME                                  QUERY                    SCHEDULE   RUNNING    FAILED   LAST REPORT TIME       AGE
pod-cpu-request-billing-run-once      pod-cpu-request-aws                 Finished            2020-04-30T00:00:00Z   79s
pod-memory-request-billing-run-once   pod-memory-request-aws              Finished            2020-04-30T00:00:00Z   79s
I created a simple script (viewReport.sh) as shown below to view any report which requires $1 as the name of the report from oc get reports
Lesson learned from the last test (https://shanna-chan.blog/2019/07/26/openshift4-vsphere-static-ip/), and I got questions around clarification on using static IP. My apologies for the confusion from my last test since it was my test without any real documentation. I want to record all my errors so I can help others to troubleshoot.
Anyway, I decided to retest the installation of OCP 4.3 using static IP. The goal to clarify the installation instructions my last note from the last blog if you are trying to install OCP4 on the VMware environment manually using static IP.
Environment:
OCP 4.3.5
vSphere 6.7
List of VMs:
Bootstrap 192.168.1.110
Master0 192.168.1.111
Master1 192.168.1.112
Master2 192.168.1.113
Worker0 192.168.1.114
Worker1 192.168.1.115
Prerequisites:
The following components are already running in my test environment.
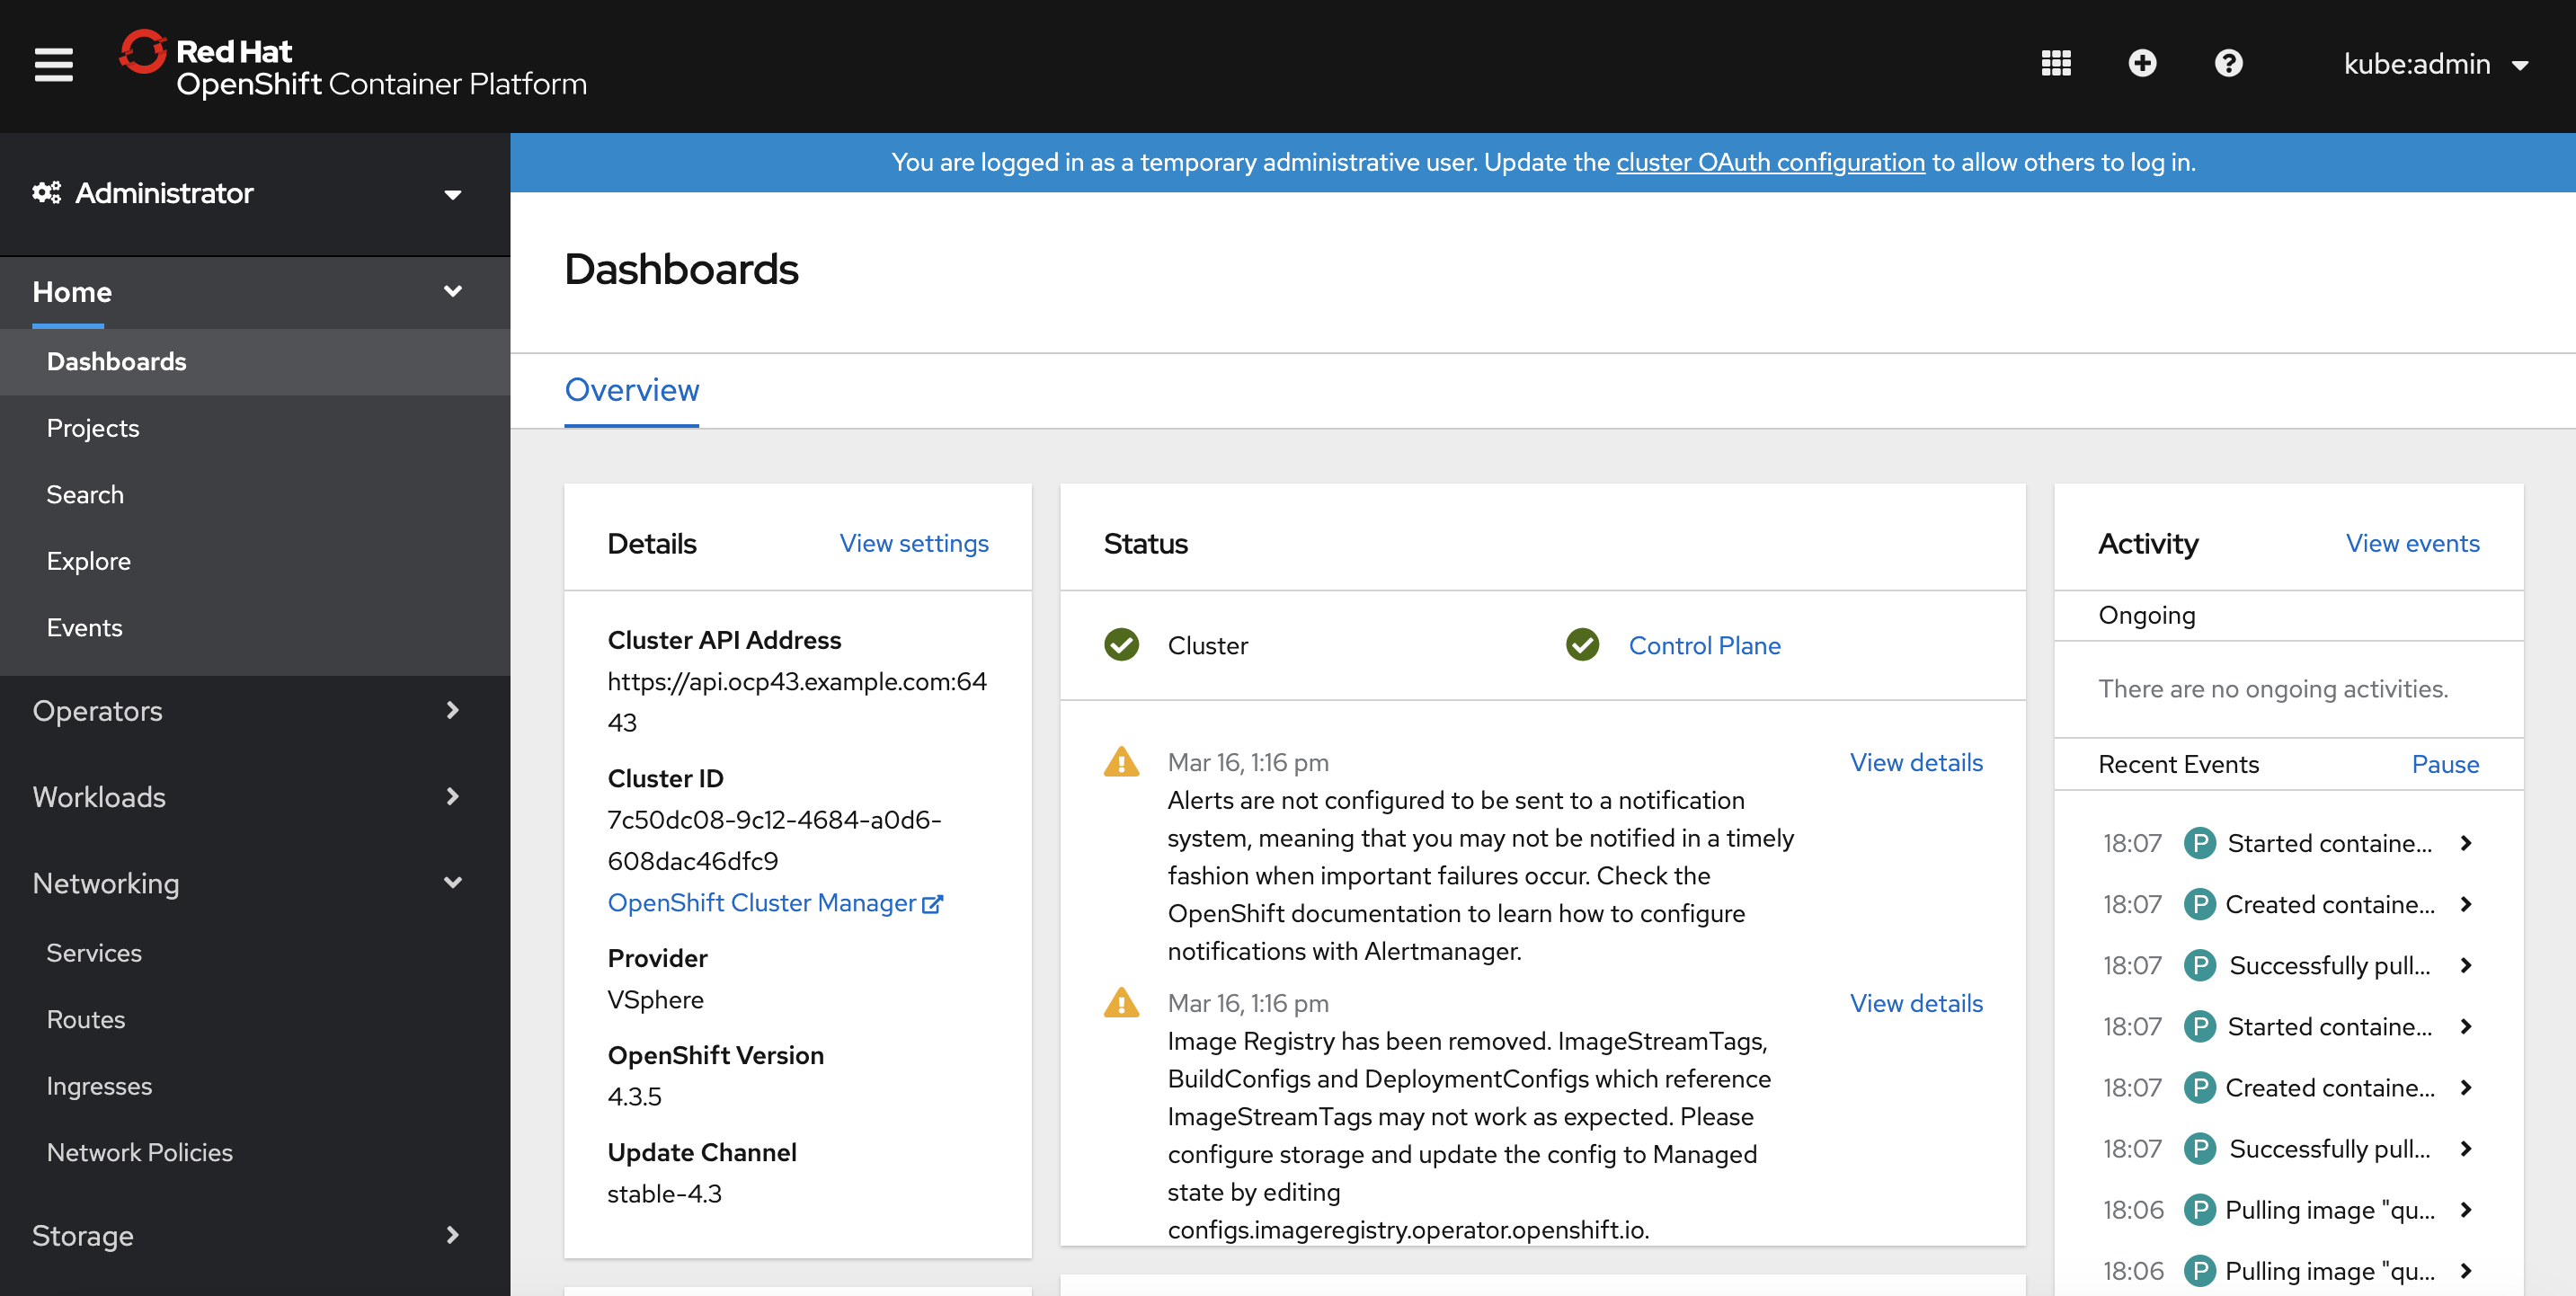
Configures the zone files for all the DNS entries. An example configuration is shown below.
; The api points to the IP of your load balancer
api.ocp43	IN	A	192.168.1.72
api-int.ocp43	IN	A	192.168.1.72
;
; The wildcard also points to the load balancer
*.apps.ocp43	IN	A	192.168.1.72
;
; Create entry for the bootstrap host
bootstrap0.ocp43	IN	A	192.168.1.110
;
; Create entries for the master hosts
master01.ocp43	IN	A	192.168.1.111
master02.ocp43	IN	A	192.168.1.112
master03.ocp43	IN	A	192.168.1.113
;
; Create entries for the worker hosts
worker01.ocp43	IN	A	192.168.1.114
worker02.ocp43	IN	A	192.168.1.115
;
; The ETCd cluster lives on the masters...so point these to the IP of the masters
etcd-0.ocp43	IN	A	192.168.1.111
etcd-1.ocp43	IN	A	192.168.1.112
etcd-2.ocp43	IN	A	192.168.1.113
;
; The SRV records are IMPORTANT....make sure you get these right...note the trailing dot at the end...
_etcd-server-ssl._tcp.ocp43	IN	SRV	0 10 2380 etcd-0.ocp43.example.com.
_etcd-server-ssl._tcp.ocp43	IN	SRV	0 10 2380 etcd-1.ocp43.example.com.
_etcd-server-ssl._tcp.ocp43	IN	SRV	0 10 2380 etcd-2.ocp43.example.com.
Load balancer
Update /etc/haproxy/haproxy.cfg with cluster information. An example is shown below.
#---------------------------------------------------------------------

listen stats
    bind *:9000
    mode http
    stats enable
    stats uri /
    monitor-uri /healthz

#---------------------------------------------------------------------
#Cluster ocp43 - static ip test
frontend openshift-api-server
    bind *:6443
    default_backend openshift-api-server
    mode tcp
    option tcplog

backend openshift-api-server
    balance source
    mode tcp
    #server bootstrap0.ocp43.example.com 192.168.1.110:6443 check
    server master01.ocp43.example.com 192.168.1.111:6443 check
    server master02.ocp43.example.com 192.168.1.112:6443 check
    server master03.ocp43.example.com 192.168.1.113:6443 check

frontend machine-config-server
    bind *:22623
    default_backend machine-config-server
    mode tcp
    option tcplog

backend machine-config-server
    balance source
    mode tcp
    # server bootstrap0.ocp43.example.com 192.168.1.110:22623 check
    server master01.ocp43.example.com 192.168.1.111:22623 check
    server master02.ocp43.example.com 192.168.1.112:22623 check
    server master03.ocp43.example.com 192.168.1.113:22623 check

frontend ingress-http
    bind *:80
    default_backend ingress-http
    mode tcp
    option tcplog

backend ingress-http
    balance source
    mode tcp
    server worker01.ocp43.example.com 192.168.1.114:80 check
    server worker02.ocp43.example.com 192.168.1.115:80 check

frontend ingress-https
    bind *:443
    default_backend ingress-https
    mode tcp
    option tcplog

backend ingress-https
    balance source
    mode tcp
    server worker01.ocp43.example.com 192.168.1.114:443 check
    server worker02.ocp43.example.com 192.168.1.115:443 check
Web Server
Configure a web server. In my example, I configure httpd on an RHEL VM.
Backup install-config.yaml and copy it into the installation directory
Generate Kubernetes manifests for the cluster:
$./openshift-install create manifests --dir=./ocp43
INFO Consuming Install Config from target directory
WARNING Making control-plane schedulable by setting MastersSchedulable to true for Scheduler cluster settings
$ ./openshift-install create ignition-configs --dir=./ocp43
INFO Consuming Common Manifests from target directory
INFO Consuming Worker Machines from target directory
INFO Consuming Master Machines from target directory
INFO Consuming OpenShift Install (Manifests) from target directory
INFO Consuming Openshift Manifests from target directory
Upload the rhcos-4.3.0-x86_64-metal.raw.gz to web server location
Upload all the ignition files to the webserver location
Update the file permission on the *.ign files on the webserver:
chmod 644 *.ign
Note: check and make sure that you can download the ignition files and gz file for the webserver.
Custom ISO
Create all custom ISO files with the parameters that you need for each VMs. This step can skip if you plan to type all the kernel parameters by hand when prompt.
Download rhcos-4.3.0-x86_64-installer.iso and rhcos-4.3.0-x86_64-metal.raw.gz
Extract ISO to a temporary location:
sudo mount rhcos-410.8.20190425.1-installer.iso /mnt/
mkdir /tmp/rhcos
rsync -a /mnt/* /tmp/rhcos/
cd /tmp/rhcos
vi isolinux/isolinux.cfg
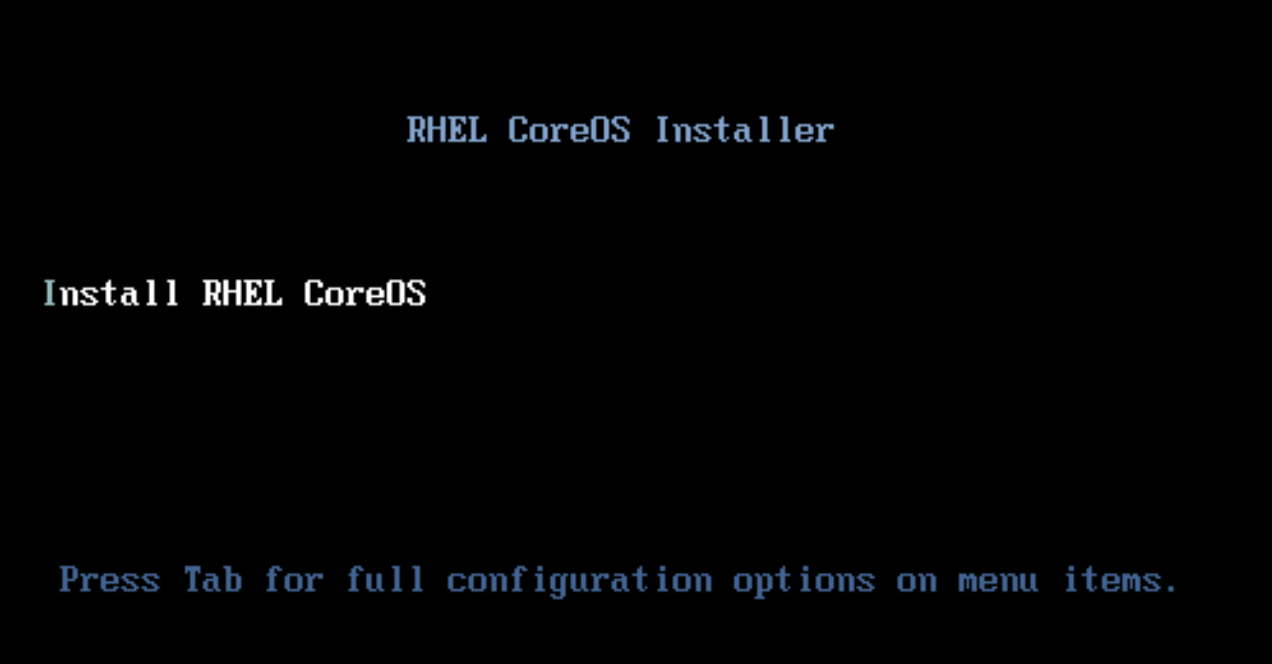
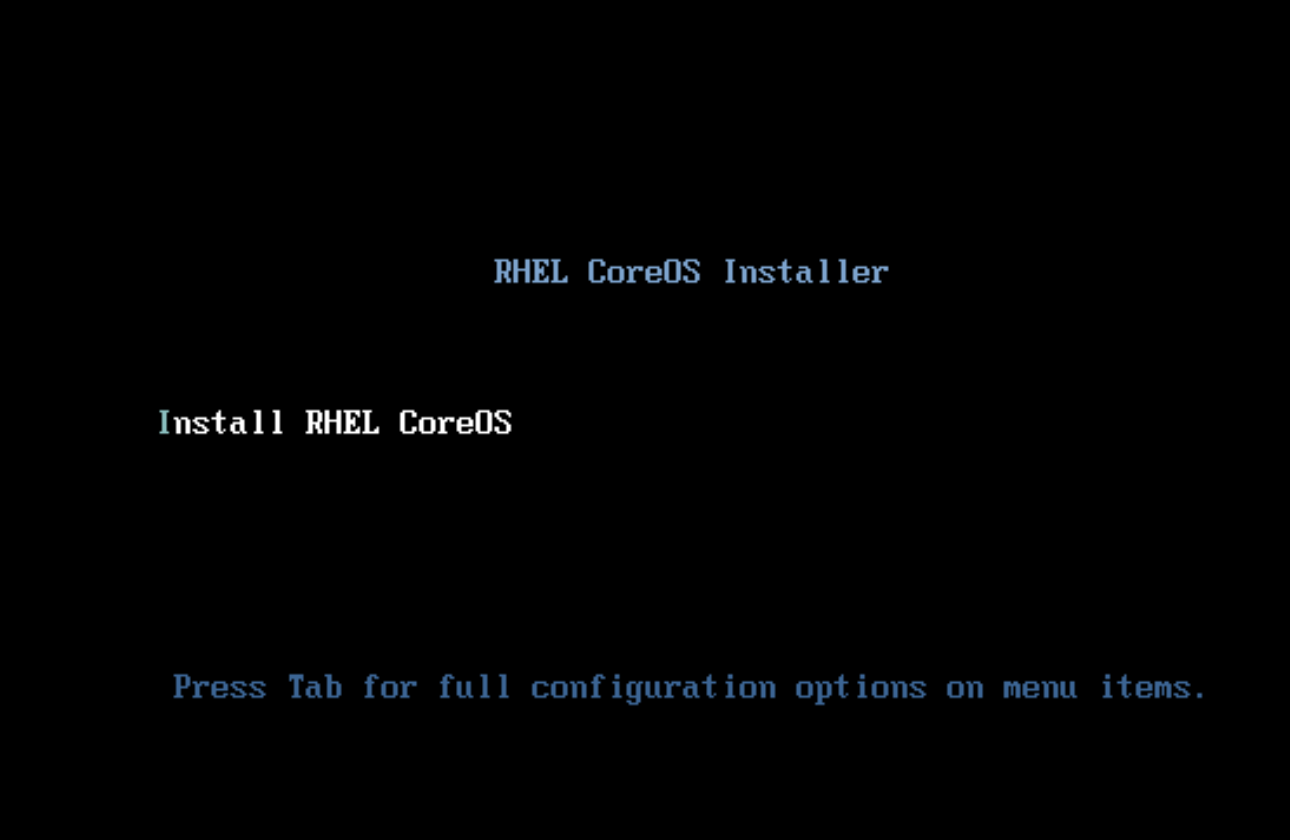
Modify the boot entry similar to this:
label linux
  menu label ^Install RHEL CoreOS
  kernel /images/vmlinuz
  append initrd=/images/initramfs.img nomodeset rd.neednet=1 coreos.inst=yes ip=192.168.1.110::192.168.1.1:255.255.255.0:bootstrap0.ocp43.example.com:ens192:none nameserver=192.168.1.188 coreos.inst.install_dev=sda coreos.inst.image_url=http://192.168.1.230:8080/rhcos-4.3.0-x86_64-metal.raw.gz coreos.inst.ignition_url=http://192.168.1.230:8080/bootstrap.ign
where:
ip=<ip address of the VM>::<gateway>:<netmask>:<hostname of the VM>:<interface>:none
Upload all the custom ISOs to the datastore for VM creation via vCenter
You will repeat the steps for all VMs with the specific IP and ign file. You only need to create individual VM for the cluster if you don’t want to type the kernel parameters at the prompt when installing via the ISO. I would recommend that since it actually takes less time to do that than typing the kernel parameters each time.
Create VM using custom ISO
Create a resource folder
Action -> New folder -> New VM or Template folder
I normally give the name as the cluster id
Create VM with 4 CPU and 16 RAM
Action -> New Virtual Machine
Select Create New Virtual Machine -> click Next
Add name
Select the VM folder -> Next
Select datacenter -> Next
Select storage -> Next
Use ESXi 6.7 -> Next
Select Linux and RHEL 7 -> Next
Use these parameters:
CPU: 4
Memory: 16 (Reserve all guest memory)
120 GB disk
Select the corresponding ISO from Datastore and check “connect”
Power on the bootstrap, masters and workers VMs as the steps below
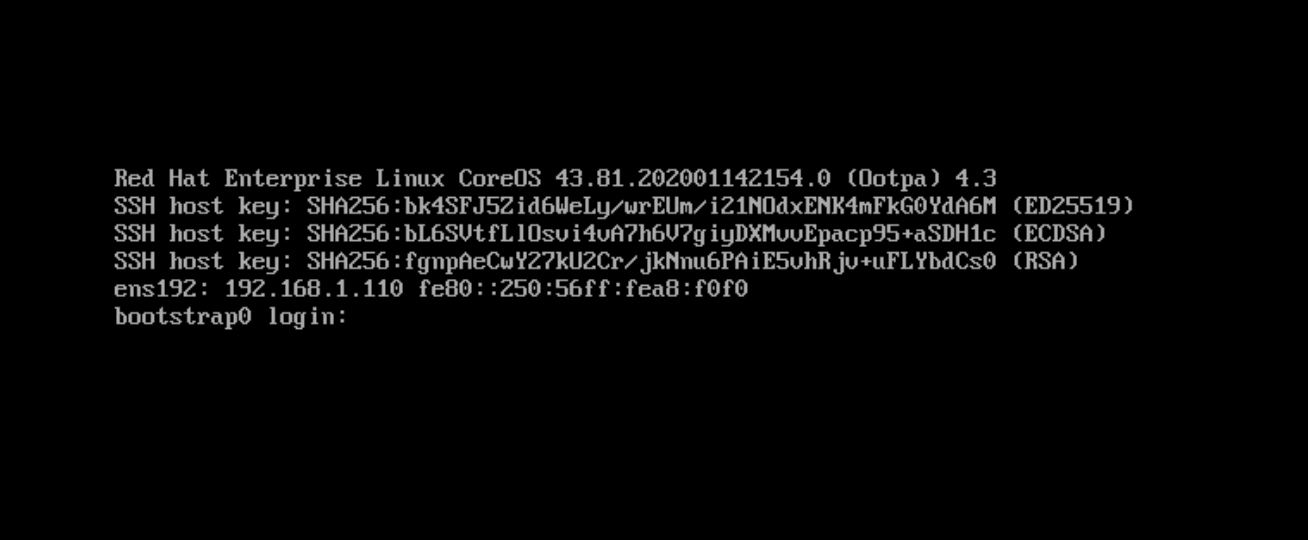
Go the VM console:
Hit Enter
You should see the login screen once the VM boots successfully
repeat on all servers and make sure the specific ISO for the given VM is used.
Tips: you can clone the existing VM and just modify the ISO files for VM creation.
Creating Cluster
Monitor the cluster:
./openshift-install --dir=<installation_directory> wait-for bootstrap-complete --log-level=info
INFO Waiting up to 30m0s for the Kubernetes API at https://api.ocp43.example.com:6443...
INFO API v1.16.2 up
INFO Waiting up to 30m0s for bootstrapping to complete...
INFO It is now safe to remove the bootstrap resources
From the bootstrap VM, similar log messages are shown:
$ ssh -i ~/.ssh/vsphere-ocp43 core@bootstrap-vm
$ journalctl -b -f -u bootkube.service
...
Mar 16 20:03:57 bootstrap0.ocp43.example.com bootkube.sh[2816]: Tearing down temporary bootstrap control plane...
Mar 16 20:03:57 bootstrap0.ocp43.example.com podman[18629]: 2020-03-16 20:03:57.232567868 +0000 UTC m=+726.128069883 container died 695412d7eece5a9bd099aac5b6bc6a8d412c8037b14391ff54ee33132ebce0e1 (image=quay.io/openshift-release-dev/ocp-v4.0-art-dev@sha256:222fbfd3323ec347babbda1a66929019221fcee82cfc324a173b39b218cf6c4b, name=zen_lamarr)
Mar 16 20:03:57 bootstrap0.ocp43.example.com podman[18629]: 2020-03-16 20:03:57.379721836 +0000 UTC m=+726.275223886 container remove 695412d7eece5a9bd099aac5b6bc6a8d412c8037b14391ff54ee33132ebce0e1 (image=quay.io/openshift-release-dev/ocp-v4.0-art-dev@sha256:222fbfd3323ec347babbda1a66929019221fcee82cfc324a173b39b218cf6c4b, name=zen_lamarr)
Mar 16 20:03:57 bootstrap0.ocp43.example.com bootkube.sh[2816]: bootkube.service complete
Load balancer status
Remove the bootstrap from the Load Balancer. You can check the status of LB from the status page
$ ./openshift-install --dir=./ocp43 wait-for install-complete
INFO Waiting up to 30m0s for the cluster at https://api.ocp43.example.com:6443 to initialize...
INFO Waiting up to 10m0s for the openshift-console route to be created...
INFO Install complete!
INFO To access the cluster as the system:admin user when using 'oc', run 'export KUBECONFIG=/Users/shannachan/projects/ocp4.3/ocp43/auth/kubeconfig'
INFO Access the OpenShift web-console here: https://console-openshift-console.apps.ocp43.example.com
INFO Login to the console with user: kubeadmin, password: xxxxxxxxxxxxxx
There are many ways to install OCP4. One of the most common ask is how to install OCP4 with the static IP address on the vSphere environment. This is one of the use cases that I want to test out and hope I can share my lessons learned.
Environment:
vSphere 6.7 Update2
Run install from macOS Mojave 10.14.5
Requirements:
No DHCP server
Need to use static IP addresses
Problems I had:
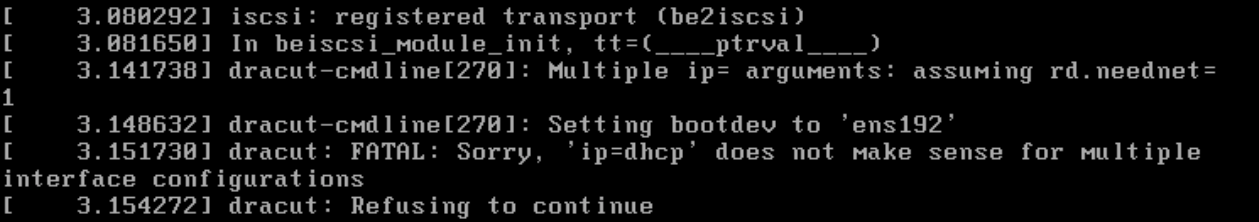
Error #1: Dracut: FATAL: Sorry, ‘ip=dhcp’ does not make sense for multiple interface configurations.
Cause:
When I tried to overwrite the IP address by setting the kernel parameters using ip=<ip>::<gateway>:<net mask>:<FQDN>:<interface>:none with cloning from OVA.
Solution:
Setting the IP parameter before the initramfs is created from the rhcos-install.iso instead of from OVA.
Here are steps to create custom ISO with the parameters to simplify the process. You can use the downloaded ISO, but it will be a lot of typing, so the following steps are very useful when creating many VMs from the ISO.
The above components are required in my setup. I used the link [3] in the Reference section to setup DNS, load balancer, and webserver. I configured NTP on my DNS, webserver, load balancer and make sure I configure the time on my ESXi server as well. The filetranspiler is an awesome tool for manipulating the ignition files. I used it thought out the test here.
Preparing the infrastructure:
I started my installation with OCP 4 official documentation for vSphere (Reference [1] below).
SSH keygen
Captured my example steps here. Please use your own value.
Copy <installation_directory>/bootstrap.ign to <filetranspile_directory>/
Create bootstrap hostname file:
echo "bootstrap.ocp4.example.com" > hostname
move hostname file to <filetranspile_directory>/bootstrap/etc/
Create ifcfg-ens192 file under
<filetranspile_directory>/bootstrap/etc/sysconfig/network-scripts with following content
NAME=ens192DEVICE=ens192TYPE=EthernetBOOTPROTO=noneONBOOT=yesIPADDR=<bootstrap IP address>NETMASK=<netmask>GATEWAY=<gateway>DOMAIN=example.comDNS1=<dns>PREFIX=24DEFROUTE=yesIPV6INIT=no
Run this command to create new boostrap ignition file:
cd <filetranspile_directory>
./filetranspile -i bootstrap.ign -f bootstrap -o bootstrap-static.ign
Note that master0.ign is used in the kernel parameter when installing the ISO.
Create VM from the custom ISO
Create VM with 4 CPU and 16 RAM
Select the custom ISO
add “disk.EnableUUID”: Specify TRUE under VM Options and Edit Configuration.
Power on the VM
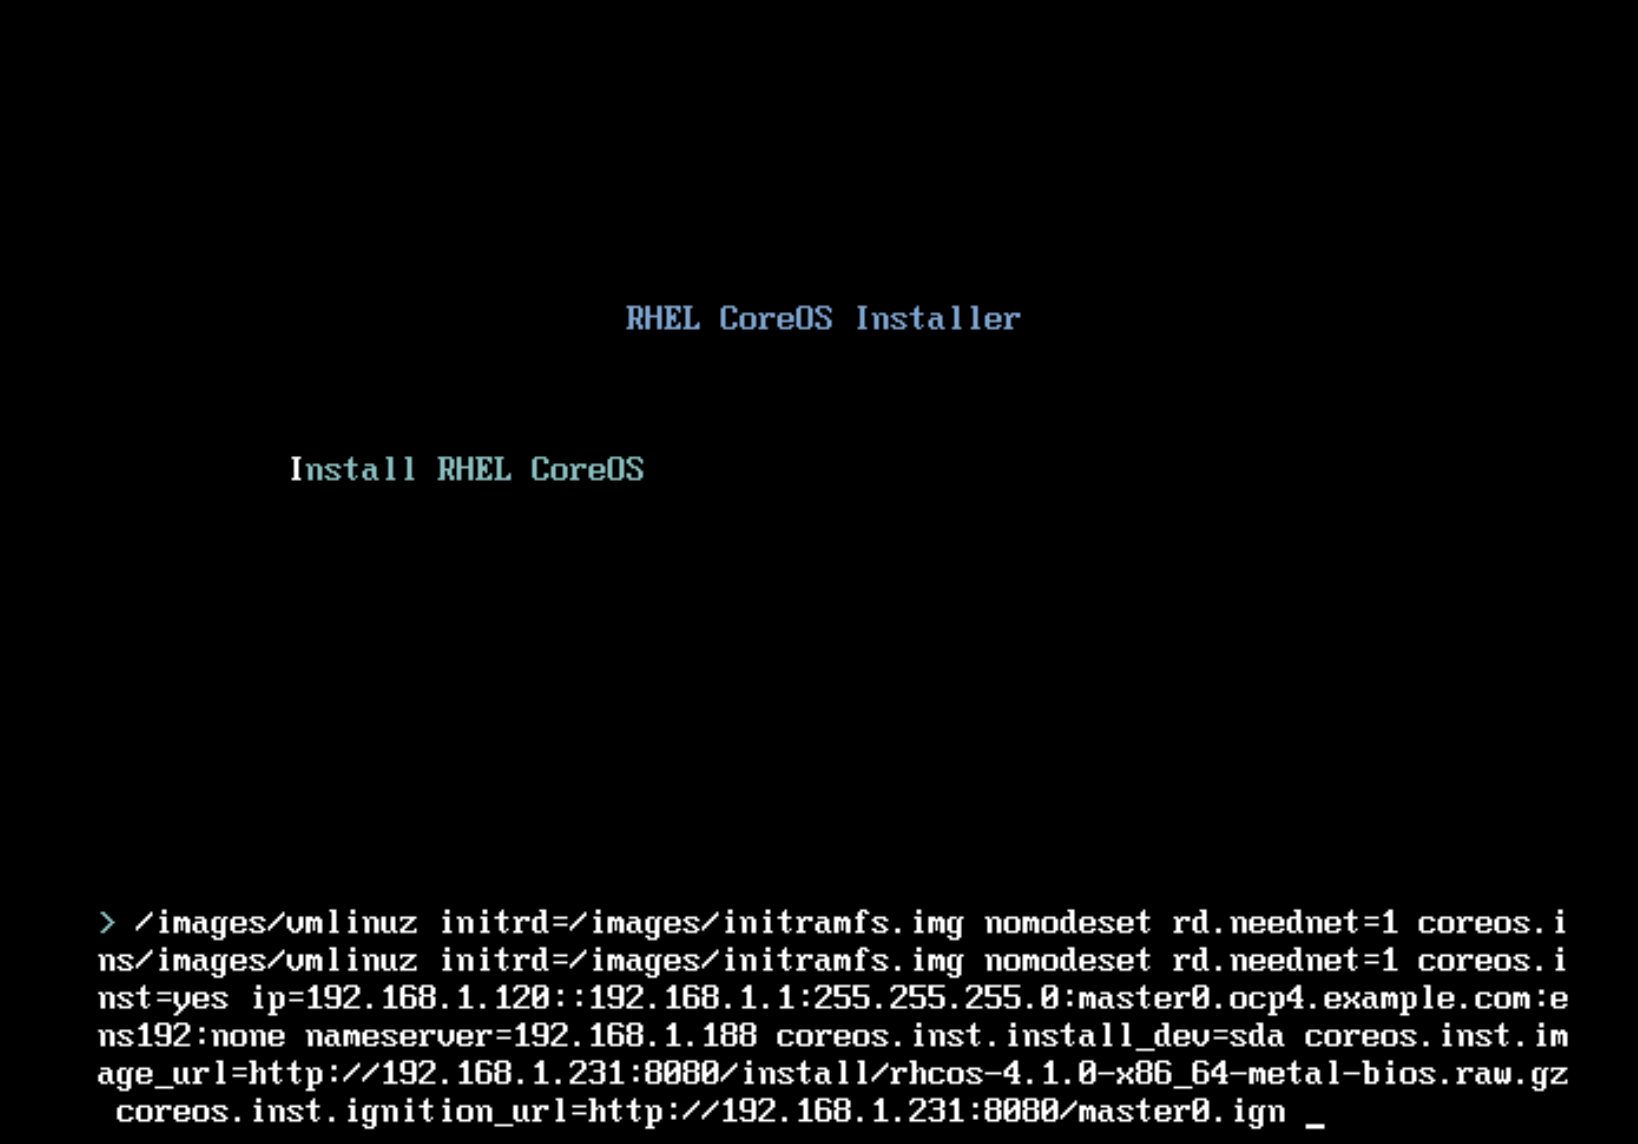
Go the VM console:
Hit <Tab>
you can modify the parameters per each server here.
Hit <enter>
The server will reboot after installation.
Repeat for all masters and workers.
Installation:
When you have all the VMs created, run the following command.
$ openshift-install --dir=ocp4 wait-for bootstrap-complete --log-level debug
DEBUG OpenShift Installer v4.1.7-201907171753-dirty DEBUG Built from commit 5175a461235612ac64d576aae09939764ac1845d INFO Waiting up to 30m0s for the Kubernetes API at https://api.ocp4.example.com:6443... INFO API v1.13.4+3a25c9b upINFO Waiting up to 30m0s for bootstrapping to complete... DEBUG Bootstrap status: completeINFO It is now safe to remove the bootstrap resources
This blog assumes that you went to try.openshift.com and created your OCP 4.1 IPI cluster. If you have not, you can go to try.openshift.com –> Get Started to set up an OCP 4.1 cluster.
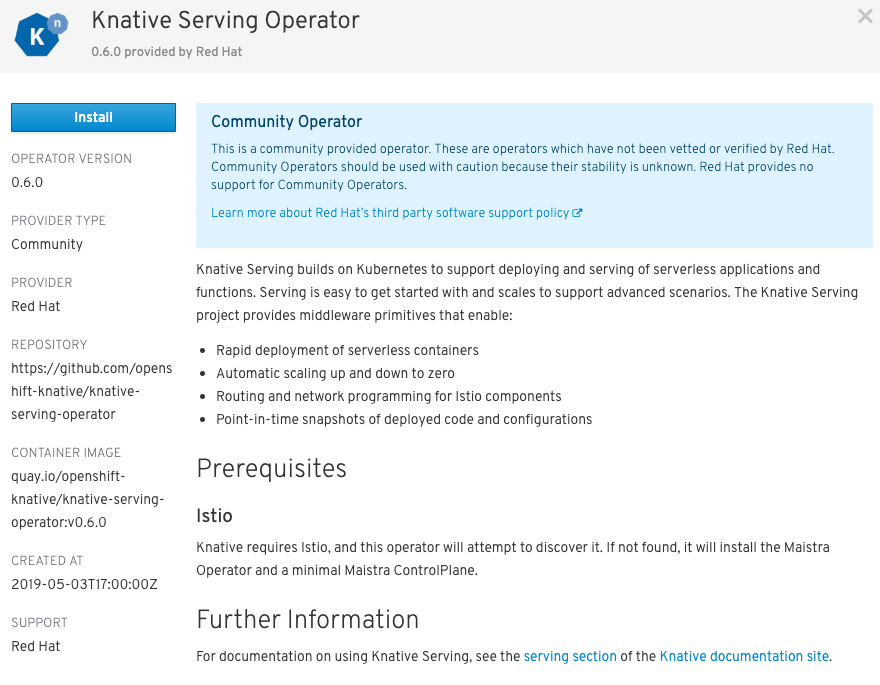
Install Istio (Maistra 0.11)
Istio is required before installing Knative. However, Knative operator will install the minimum Istio components if Istio is not installed on the platform. For my test, I did install service mesh on OCP 4.1 using the community version. Here are my steps:
#to get the name of the operator pod
oc get pods
#view the logs of the pod
oc logs <name of the pod from above step>

#log shown as below
{"level":"info","ts":1562602857.4691303,"logger":"kubebuilder.controller","caller":"controller/controller.go:153","msg":"Starting workers","Controller":"servicemeshcontrolplane-controller","WorkerCount":1}
Create custom resource as cr.yaml using the below content.
apiVersion: maistra.io/v1
kind: ServiceMeshControlPlane
metadata:
  name: basic-install
spec:
  # NOTE, if you remove all children from an element, you should remove the
  # element too.  An empty element is interpreted as null and will override all
  # default values (i.e. no values will be specified for that element, not even
  # the defaults baked into the chart values.yaml).
  istio:
    global:
      proxy:
        # constrain resources for use in smaller environments
        resources:
          requests:
            cpu: 100m
            memory: 128Mi
          limits:
            cpu: 500m
            memory: 128Mi

    gateways:
      istio-egressgateway:
        # disable autoscaling for use in smaller environments
        autoscaleEnabled: false
      istio-ingressgateway:
        # disable autoscaling for use in smaller environments
        autoscaleEnabled: false
        # set to true to enable IOR
        ior_enabled: true

    mixer:
      policy:
        # disable autoscaling for use in smaller environments
        autoscaleEnabled: false

      telemetry:
        # disable autoscaling for use in smaller environments
        autoscaleEnabled: false
        # constrain resources for use in smaller environments
        resources:
          requests:
            cpu: 100m
            memory: 1G
          limits:
            cpu: 500m
            memory: 4G

    pilot:
      # disable autoscaling for use in smaller environments
      autoscaleEnabled: false
      # increase random sampling rate for development/testing
      traceSampling: 100.0

    kiali:
      # change to false to disable kiali
      enabled: true

      # to use oauth, remove the following 'dashboard' section (note, oauth is broken on OCP 4.0 with kiali 0.16.2)
      # create a secret for accessing kiali dashboard with the following credentials
      dashboard:
        user: admin
        passphrase: admin

    tracing:
      # change to false to disable tracing (i.e. jaeger)
      enabled: true
Install service mesh
oc project istio-system
oc create -f cr.yaml

#it will take a while to have all the pods up
watch 'oc get pods'